Reporting Strategy for Multiple Audiences: 6 Tips for Getting Started
40+ people share their top tips on how to create reports for management teams, senior executives, board members, and in-house teams.


At Talend Connect 2021, we dove deep into what data health really means (clean, compliant, accessible data), what thorny business problems are solved by having healthy data, and what inspirational companies we can look to as an example. Most importantly, we learned the incredible difference that healthy data can make not only in business, but in the world. We had an incredible lineup of guest speakers, keynotes, specialists, and panelists discussing every aspect of data health and its impact.
Global survey of IT and business executives reveals how a mature data strategy relates to business performance and resilience. Organizations fall under one of four categories when it comes to enterprise data maturity, and they need to be aware of how to address multi-dimensional challenges of a hybrid future.
The ability to discover insights from past events, transactions and interactions is how many customers currently utilize Qlik. Qlik’s unique approach to Business Intelligence (BI) using a unique analytics engine and intuitive interface has democratized BI for typical business users, who usually have little to no technical savvy.
Data transforms businesses. When done right it creates value and allows business leaders to make the most advantageous decisions, in real-time. That’s where the data lifecycle comes into play. Managing data and its flow, from the edge to the cloud, is one of the most important tasks in the process of gaining data intelligence.
Advances in the performance and capability of Artificial Intelligence (AI) algorithms has led to a significant increase in adoption in recent years. In a February 2021 report by IDC, they estimate that world-wide revenues from AI will grow by 16.4% in 2021 to USD $327 billion. Furthermore, AI adoption is becoming increasingly widespread and not just concentrated within a small number of organisations.
In my main position, as a data scientist at SIL International, I work on expanding language possibilities with AI. Practically this includes applying recent advances in Natural Language Processing (NLP) to low resource and multilingual contexts. We work on things like spoken language identification, multilingual dialogue systems, machine translation, and translation quality estimation.
As data continues to grow at an exponential rate, our customers are increasingly looking to advance and scale operations through digital transformation and the cloud. These modern digital businesses are also dealing with unprecedented rates of data volume, which is exploding from terabytes to petabytes and even exabytes which could prove difficult to manage.
How life for data professionals keeps getting better (and more interesting!)
The job of a modern marketer never stops. In today’s always-on, digital world you can spend forever tinkering with taglines and targeting and still never get to the bottom of why some campaigns perform while others don’t. Is your messaging personalized enough? Are you utilizing the right channels? Are you allocating your budget correctly? To dig into these insights you need data.
Operational Database is a relational and non-relational database built on Apache HBase and is designed to support OLTP applications, which use big data. The operational database in Cloudera Data Platform has the following components: Atlas provides open metadata management and governance capabilities to build a catalog of all assets, and also classify and govern these assets. The SDX layer of CDP leverages the full spectrum of Atlas to automatically track and control all data assets.
At Singular, we have a pipeline that ingests data about ad views, ad clicks, and app installs from millions of mobile devices worldwide. This huge mass of data is aggregated on an hourly and daily basis. We enrich it with various marketing metrics and offer it to our customers to analyze their campaigns’ performance and see their ROI. The upshot is that we receive tens of thousands of events per second and handle dozens of terabytes of data every day, managing a data set of several petabytes.
The phenomenon of web-based, at-your-door-in-minutes, restaurant food-delivery service is widespread and commonplace nowadays, with various apps and platforms, such as Grubhub or DoorDash, providing diners with an at-home eating experience – look up a restaurant, choose what you want to eat, and your food is on its way. The same can be said about grocery shopping.
In legacy analytical systems such as enterprise data warehouses, the scalability challenges of a system were primarily associated with computational scalability, i.e., the ability of a data platform to handle larger volumes of data in an agile and cost-efficient way.
Gift guides come in all shapes and sizes. There are shopper’s guides for sporting goods and wine, aimed at travelers and crafty types, and offering electronics or candy. Since there is no gift guide we’re aware of for data buyers, this is our chance to create the first such guide. Is your wife, best friend, or dad a nerd? No, not that kind of nerd, not an over-the-counter nerd, a data nerd! If so, this stuff will stuff their stocking but good. Remember Sears’ Wish Book?
Machine learning (ML) model serving refers to the series of steps that allow you to create a service out of a trained model that a system can then ping to receive a relevant prediction output for an end user. These steps typically involve required pre-processing of the input, a prediction request to the model, and relevant post-processing of the model output to apply business logic.
This week, ThoughtSpot gathered virtually with thousands of global customers, partners, and friends to share our vision for the future of analytics at Beyond 2021. A future where everyone in your business can create personalized insights and operationalize them to drive smarter business actions. And where innovative brands like Snowflake, Starbucks, Just Eat Takeaway, and Opendoor are already building their businesses on data with the Modern Analytics Cloud.
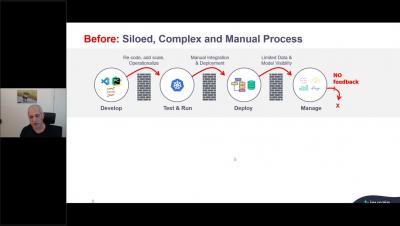
We are excited by the endless possibilities of machine learning (ML). We recognise that experimentation is an important component of any enterprise machine learning practice. But, we also know that experimentation alone doesn’t yield business value. Organizations need to usher their ML models out of the lab (i.e., the proof-of-concept phase) and into deployment, which is otherwise known as being “in production”.
In some of my earlier blog posts, I’ve gone through some more novel visualizations, such as the Sankey chart and distribution plot. But, for this post, it’s time to go back to the more common Combo chart, also sometimes referred to as a dual axis chart.
You can now set up Fivetran data pipelines via Databricks Partner Connect. Here’s how to do it.
Snowflake is the data backbone for thousands of businesses, enabling data access and governance needed to deliver value. Interactive use cases in some data applications and embedded analytics, however, pose a particular challenge. Traditionally, you needed an additional caching layer to provide the required speed and throughput these solutions require—which also increased costs and architectural complexity.
A look at Qlik Replicate's zero-footprint architecture and how it is designed for scalability and flexibility.
A recent survey from Wakefield Research finds that when enterprises build their own data pipelines, decision-making and revenue suffer.
It’s no secret that Data Scientists have a difficult job. It feels like a lifetime ago that everyone was talking about data science as the sexiest job of the 21st century. Heck, it was so long ago that people were still meeting in person! Today, the sexy is starting to lose its shine. There’s recognition that it’s nearly impossible to find the unicorn data scientist that was the apple of every CEO’s eye in 2012.
As we get closer to the end of 2021, looking back the data and analytics technologies have evolved significantly over the last few years. We have seen the introduction of augmented analytics capabilities embracing user self-service and multimodal delivery of analytics insights. In addition, we have seen new data integration and catalog capabilities in response to the demands of new regulations and governance needs.
A good database schema is indispensable for making data warehouses work. Get it wrong, and you’ll be in a world of hurt.
Follow these tips to ensure that your database schema delivers maximum utility for data warehouse users, data analysts, and data scientists.
We constantly hear about UX Analytics. Analytics must always be a part of the design process of an app from the very beginning. We also hear tons about UI/UX design. However, and definitely during a redesign, UI and UX changes based on product analytics need to run parallel processes. So how come we never hear about UI Analytics?
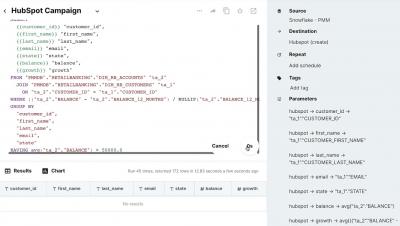
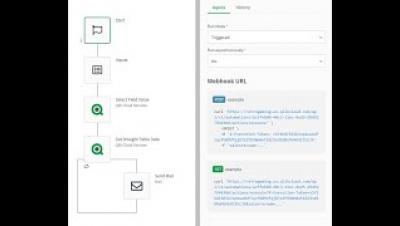
We’re excited to announce that we’ve teamed up with Rivery to offer our data pipeline and monitoring solutions in one. Our one-click Data Kits streamline the analytics process, saving teams valuable time so they can act on business incidents fast. To kick things off, we’re releasing the Anodot Marketing Analytics Monitoring Kit. Now you can start tracking your marketing campaigns instantly, and make the moves that will make the most of your ad spend.
With the general availability of Cloudera DataFlow for the Public Cloud (CDF-PC), our customers can now self-serve deployments of Apache NiFi data flows on Kubernetes clusters in a cost effective way providing auto scaling, resource isolation and monitoring with KPI-based alerting. You can find more information in this release announcement blog post and in this technical deep dive blog post. Any customer willing to run NiFi flows efficiently at scale should now consider adopting CDF-PC.
At Snowday 2021, Snowflake announced exciting new product capabilities that expand what is possible in the Data Cloud. In addition to announcing Python support in Snowpark (currently in private preview), these latest innovations make it easier for organizations to maintain business continuity across clouds and regions; help data engineers and data scientists build pipelines, ML workflows, and data applications faster; and remove the complexity of getting the right data into the hands of customers.
Today, the world is moving faster than ever before. In an age where a single insight can be the difference between hitting your number and hitting a wall, it’s never been more important to have a finger on the pulse of your business. This means understanding everything that’s happening, as it’s happening, so you can take smarter actions for your business in the moment.
At the end of 2019, I did something few senior leaders ever do: left my comfortable corporate job at a global, multi-billion dollar software organization to join a little known Series E analytics startup called ThoughtSpot.
Today, we announced our Series F funding at ThoughtSpot, valuing the company at $4.2 billion. As the Co-founder and Executive Chair, it’d be customary to write a post that celebrates this milestone, shares lessons learned, and the usual. Those can come later. Instead, I want to take this opportunity to express my gratitude to all the people that have been a critical part of my journey as an entrepreneur, both at ThoughtSpot and Nutanix (now valued at $7B+).
As we announce to the world today that ThoughtSpot is now worth $4.2B, I am overwhelmed with gratitude. I am grateful to the customers who had the courage to challenge the status quo and give us a shot inside their companies. I am equally grateful to the entrepreneurs and investors who had the courage to join us and build a company that is changing what's possible with data. Often, people say it's hard to be courageous in the face of adversity. I say that’s conformist bullshit.
Business intelligence (BI) has gotten so sophisticated that a variety of end users within an organization may be eager to use data to guide their decisions. Unfortunately, most businesses have a very small data analysis or BI team. How can companies like this enable more people to use more data more effectively without overwhelming their BI staff?
Material Bank, the world’s largest materials marketplace, provides a fast and powerful way to search and sample fixtures, construction materials, and textiles from hundreds of different brands. They serve both direct customers and retailers in the architecture and design industry, including massive companies such as Ethan Allen, Home Depot, and Lowe’s.
The word “data” is ubiquitous in narratives of the modern world. And data, the thing itself, is vital to the functioning of that world. This blog discusses quantifications, types, and implications of data. If you’ve ever wondered how much data there is in the world, what types there are and what that means for AI and businesses, then keep reading!
Arjun (my son) sat next to me at my desk. He was a bit nervous but we had practiced 3 times before he was ‘on stage’ in front of hundreds of people and the zoom meeting turned to him. My ten year old began to demonstrate how to deploy an Operational Database in AWS, showcasing how auto-scaling worked and how to set up replication. All of the sales team and my colleagues were quite impressed with him, and I am very proud of him.
When we founded Snowflake, we set out to build an innovative platform. We had the opportunity to take into account what had worked well and what hadn’t in prior architectures and implementations. We saw how we could leverage the cloud to rethink the limits of what was possible.
Much of my focus over the last couple of decades has been in analytics, big data, and AI, and Joe DosSantos and I discussed the progression of these fields over time in a recent Data Brilliant podcast episode. My subtitle for that episode might be, “The Promise and Perils of a Hot New Field,” as we addressed several aspects of how these popular concepts have evolved in the first fifth of the 21st century.
At Snowflake, we are on a mission to help customers unleash their data. Our view on the ecosystem is that Snowflake provides the cross-cloud data infrastructure and technology that our partners can stand upon to deliver advanced solutions that empower business users.
Part of our vision at Qlik is to simplify analysis for everyone – meaning that Qlik Sense is not just a tool for IT and the data analyst but something that can be put in the hands of everyone.
A leading researcher explains how emotion, intuition and storytelling can be more powerful than data.
It’s not every day that something free gets more perks added and continues to be free. To break with that, we’re super proud and super excited to release Countly Community Edition 21.11, and with it, four new and seriously powerful features. This release is not just an upgrade, but proof of our commitment to keep democratizing product analytics and to deliver a state-of-the-art tool that everyone can use to deliver outstanding products on a budget.
Cloudera Data Platform (CDP) brings many improvements to customers by merging technologies from the two legacy platforms, Cloudera Enterprise Data Hub (CDH) and Hortonworks Data Platform (HDP). CDP includes new functionalities as well as superior alternatives to some previously existing functionalities in security and governance. One such major change for CDH users is the replacement of Sentry with Ranger for authorization and access control.
SANTA CLARA, Calif., Nov. 9, 2021 – Cloudera, the enterprise data cloud company, today announced Cloudera Data Platform capabilities available to help federal agencies meet requirements of the Biden Administration’s Executive Order on improving the Nation’s cybersecurity. Cloudera is committed to supporting the federal government in adhering to this executive order with the company’s technology and special government rates.
What’s struck me in the past years is how the tools we have at our disposal, at a societal and corporate level, are insufficient to solve the big challenges we face. We see this with the pandemic, climate change, social inequity and much more. And, more recently, in the disruptions in supply chains, which have created global shortages of key components and materials. To solve our biggest issues, we don’t have a choice but to get together and create joint, interwoven solutions.
The need to show data as a chart or table has become more critical for every organization as data gathering has increased. To produce a dashboard and charts that everyone can understand, developers must mix many database records. However, since the introduction of chart libraries, data visualization has improved. Interactive charts are now available through libraries and plugins.
Where and when should a utility trim vegetation near power lines to best reduce the risk of wildfires? When is the most cost-effective time to take a wind turbine out of service for general maintenance? How can customers be convinced to charge their electric vehicle or consume energy at off-peak times that relieve pressure from the power grid?
‘Supply chain shortage’ went from a vague post-apocalyptic concept to a stark reality in 2020 and 2021. The pandemic that tore across the world also exposed ugly supply chain issues (toilet paper shortage, anyone?). A lurking issue with dire consequences — often rooted in inaccurate and unreliable data — we are all discovering that supply chain shortages aren’t limited to grocery store shelves. These issues may not be as obvious to the average consumer.
Guest Author Roozbeh Aliabadi is CEO at ReadyAI Our children have the right to be AI-educated so they can thrive intellectually, emotionally, and morally alongside AI. In the next decade or so, for most children, AI will be their co-workers, drivers, insurance agents, customer service reps, bank tellers, receptionists, radiologists, in short, a natural part of their lives.
Our priority is improving the experience of every customer — without compromising the features you rely on.
Understand the impact of data transfer and egress costs across Microsoft Azure, Amazon Web Services and Google Cloud Platform.
Not to sound like Cosmo, but sometimes it seems like a project was meant to be. Talend Trust Assessor is one of those projects. In 2020, a creative plan to share Talend Trust Score™ with the world grew into a full-fledged product developed and released in record time. Stephanie Yanaga and Gray Hardell, the project’s instigators, had a shared vision: giving everyone a taste of the Trust Score with very little effort.
What is data governance? Well, for one, it is a buzzword. And, with buzzwords, we often forget to slow down and investigate what they actually entail. This article is dedicated to exploring five essential elements of data governance – emphasizing the importance of implementing it from end to end.
The Looker API allows you to programmatically manage your Looker environment. Learn how to do it here!
As our customers continue their journey to achieve healthier data, we are constantly looking for ways to help them make that journey more quickly and successfully. By applying data health concepts across Talend Data Fabric in innovative new ways, everyone from business professionals to data professionals can get more value from their data, faster.
Have you ever asked a data scientist if they wanted their code to run faster? You would probably get a more varied response asking if the earth is flat. It really isn’t any different from anything else in tech, faster is almost always better. One of the best ways to make a substantial improvement in processing time is to, if you haven’t already, switched from CPUs to GPUs.
At AgroScout, we’re taking on a massive challenge with some correspondingly exciting upside, both for us and for our customers: We’re creating an automated, AI-driven scouting platform for early detection of pests and disease in vast agricultural areas.
What is marketing analytics? Learn why it’s important to measure and optimize your marketing activities, and how to get started.
Managed data integration is the best way for enterprises to get maximum value from their data — and their data engineering teams.
Becoming a data-driven organization is not exactly getting any easier. Businesses are flooded with ever more data. Although it is true that more data enables more insight, the effort needed to separate the wheat from the chaff grows exponentially. Doing so and truly understanding the data is more important than ever, especially when data privacy regulations are tightening.
Thank you for your interest in the 451 Research Report, Living on the edge: A primer on hybrid cloud and edge infrastructure. You can download it here. 451 Research: Living on the edge: A primer on hybrid cloud and edge infrastructure Published Date: October 11, 2021 Introduction Without the internet, the cloud is nothing. But few of us really understand what is inside the internet. What is the so-called ‘edge’ of the internet, and why does it matter?
An enterprise data warehouse is critical to the long-term viability of your business.
Keep track of our data connector and dbt package releases with monthly updates.
Marketing leaders often hold partners at an arm’s length. They think the complexity and hassle of creating close business relationships with partners will outweigh the value gained. But by treating partner marketing as a secondary program, marketing organizations are missing out on an invaluable opportunity. Companies with mature partner programs grow revenue almost twice as fast as other companies, according to Forrester.