Systems | Development | Analytics | API | Testing

Debugging

Shift Left with Multibranch Pipeline Using Argo Workflows

This blog is a follow-up to our earlier discussion of multibranch pipelines and how they can help streamline software development processes. There we explored the benefits of managing pipelines in the same repository as code and how that gives developers the ability to version their pipelines alongside their code, ensuring they remain in sync.

From Server to Serverless Clients A Debugger's Point of View

The transition from a server to a serverless architecture can be tricky for any application, particularly if your application needs to instrument other people’s code. In this talk, I will go over some of the different challenges and hurdles we faced when adding support for serverless applications in our debugger. We will also discuss several struggles that affect serverless applications, and dive into what needs to be considered when making sure that a new tool’s SDK has minimal impact on the performance of your application.

5 Basic Steps To Implement The Technology Acceptance Model Of Usefulness In Your Development Organization

As engineering leaders, we all struggle to find the balance between creating cool technology and useable technology. Let’s be real. We all want to create cool things. It’s in our nature. But what’s the point of doing so when no one will use it? It’s crucial to remember that the ultimate goal of our work is to create something helpful and effective. Our work has to have a purpose.

Debugging Kong Requests: 7 Kong Gateway Troubleshooting Tips

Developers will remember times when they were trying to figure out why something they were working on wasn’t behaving as expected. Hours of frustration, too much (or perhaps never enough) caffeine consumed, and sotto voce curses uttered. And then — as if by fate — the issue is narrowed down to a simple oversight that makes perfect sense upon discovery. Problem solved!

Rookout Live Metrics

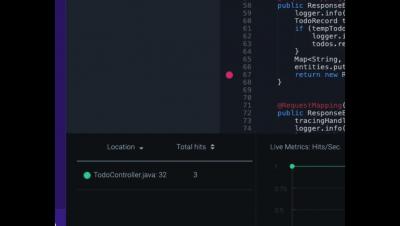
Get real-time insights into your application’s performance with ease using Rookout’s Live Metrics! In this demo, we show you how simple it is to analyze and debug your application in real-time. With just a few clicks, you can set non-breaking breakpoints in your live code and collect metrics data without affecting its performance or stopping it, even in production. Watch as we trigger multiple breakpoints and see the number of hits and timing metrics immediately appear in the message view window.

10 Dos and Don'ts When Debugging Cloud-Native Applications

Lately, everyone has been jumping on the cloud transformation bandwagon, which isn’t surprising, because when it comes to tech, you don’t want to find yourself behind, stuck with your dusty old monoliths. Just kidding – we love ourselves some good old monolith architectures – but there’s no comparing to dynamic, cloud-native technology.

Enter the Metrics: Measure App Performance In Real-Time, On-Demand

When it comes to understanding what’s happening in your code – and your service health, specifically – business and code-level metrics are key. While most developers are experts in their own code, that doesn’t mean that they’re also experts on the metrics, statistics, or distributed tracing from the code they’re working with. The code-level metrics they need are tough to set up and it’s something that no one else can do for them.

Top 10 Debugging Tools in 2023: The Only List You need!

As we move past the stage where automation is no longer the concern, intelligence is at the front seat, being the driving force of technology in almost every space. With lines of codes that are being thought upon, strategized upon, and then implemented, viruses, and bugs, are no Bueno. Since the world is moving more towards online communities than physical ones, these bugs and viruses create havoc and disorient business functioning.