Slowly Changing Dimensions in Data Science
Avoiding a common pitfall in data science by enabling history mode.


Avoiding a common pitfall in data science by enabling history mode.
Use schemas to make life easier for your analysts and engineers.
If each product is a world in its own, each industry in which that product -or service, for that matter- is deployed, is a universe. A seemingly chaotic universe full of data coming from every direction and angle that you, the product manager, need to catch, analyze, and funnel into your every day. If this does not sound easy, it is because it is not!
Cloudera Operational Database is an operational database-as-a-service that brings ease of use and flexibility to Apache HBase. Cloudera Operational Database enables developers to quickly build future-proof applications that are architected to handle data evolution. In the previous blog posts, we looked at application development concepts and how Cloudera Operational Database (COD) interacts with other CDP services.
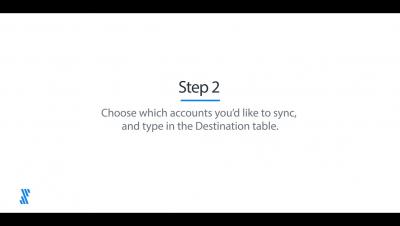
Sync data incrementally, or watch your pipeline grind to a halt.
Today, we are excited to announce the general availability (GA) of BigQuery materialized views. Materialized views (MV’s) are precomputed views that periodically cache results of a query to provide customers increased performance and efficiency.
Business analysts working with larger and larger data sets are finding traditional BI methods can't keep up with their need for speed. BigQuery BI Engine is designed to meet this need by accelerating the most popular dashboards and reports that connect to BigQuery. With the freshest data available, your analysts can identify trends faster, reduce risk, match the pace of customer demand, even improve operational efficiency in an ever-changing business climate.
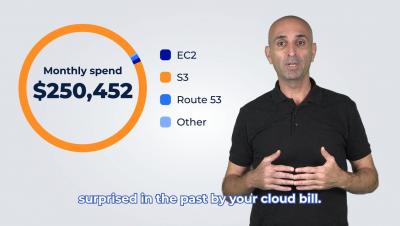
These days, there are two kinds of businesses: data-driven organizations; and companies that are about to go bust. And often, the only difference is the data stack. Data quality is an existential issue—to survive, you need a fast, reliable flow of information. The data stack is the entire collection of technologies that make this possible. Let's take a look at how any company can assemble a data stack that's ready for the future.
There is nothing permanent except change. In a world of turbulent, unpredictable change, we humans are always learning to cope with the unexpected. Hopefully, your machine learning business applications do this every moment, by adapting to fresh data. In a previous post, we discussed the impact of COVID-19 on the data science industry.
Today’s enterprise data science teams have one of the most challenging, yet most important roles to play in your business’s ML strategy. In our current landscape, businesses that have adopted a successful ML strategy are outperforming their competitors by over 9%. The implications of ML on the future of business are clear. However, only 4% of enterprise executives today report seeing success from their ML investment.
Start-ups founded on analytics have been shaking up every industry. Finance has been disrupted by Monzo's data focus, Netflix’s analytics has upended film entertainment, and Swyfft has used data to change the game for US home insurance. Today's users have come to expect analytics in their applications.
A watershed year brought continued rapid growth, major engineering advances, and partner awards from Google, AWS, Snowflake and Databricks.
Spreadsheets are everywhere! They are one of the most useful productivity tools available. They make organizing, calculating, and presenting data a breeze. Google Sheets is the spreadsheet application included in Google Workspace, which has over 2 billion users. Machine learning, or ML for short, has also become an essential business tool. Making predictions with data at low cost and high accuracy has transformed industries.
The component previewer is a feature that allows you to preview your data at each component step without having to validate packages and run full-scale production jobs. It gives you the ability to extract, transform and preview your data on any transformation component, allowing you to debug your pipeline and/or to confirm and validate your data flow logic. Component previews are similar to the data previews available on source components, which you might already be familiar with.
With a new year ahead, it’s time for financial services to pause, take stock of the “new normal,” and plan a path forward. COVID-19 forced nearly every industry to adapt to a new reality, and the financial services industry was no exception. Consumer habits shifted drastically. Suddenly, many people started working from home. Employee and customer needs changed. Adaptability was a necessity.
I’ve been a Business Intelligence (BI) analyst and evangelist for over two decades now. As you can imagine I’ve worked with many different BI platforms throughout my career, especially during my time as a BI Consultant. In this role, I was product agnostic, so from Power BI to Tableau, you name it, I used it! However, Qlik Sense quickly stood out to me as the most powerful and intuitive platform on the market.
I’ve met with lots of customers and prospects throughout my career. And, I’ve noticed that, when I’ve asked them to describe their current software situation, many would say the same things. “We should have updated this a long time ago.” “It’s embarrassing how long it takes to do a simple task.” “I bet other companies stopped doing things like this years ago.”
Adopting a cloud-based data warehouse is your shortcut to superior marketing analytics and a 360-degree view of your customers.
It’s 2021 and somehow, I’m still trying to convince people that content is one of the biggest revenue drivers there is. Back in 2017, there was an influx of “content is king” and “why content is important” blogs on LinkedIn and Medium, but it seems little notice has been taken in the years that have followed.
One of the most requested features in a data integration tool is greater flexibility around the scheduling of packages and workflows. With Xplenty, this can be achieved through the use of our Cron Expression scheduling feature. Cron is a software utility that enables Unix-based operation systems, such as Linux, to use a job scheduler. You can create cron jobs, which execute a script or command at a time of your choosing. Cron has broad applications for tasks that need time-based automation.
AWS provides many solutions for managing business data. There’s Amazon Relational Database, or Amazon RDS, which is ideal for scaling your databases on the cloud. There’s Amazon Redshift for warehousing your data. For collecting big data, we’ve looked at a number of modern data integration platforms, but Amazon CloudFront is more of a content delivery platform. So, why are we talking about CloudFront in terms of big data right now?
Five differences between Stitch vs. Dell Boomi vs. Xplenty: Real-time data provides a competitive advantage, so every business requires an analytics strategy. But many organizations struggle to integrate data because they store information in lots of locations, including apps, SaaS, and legacy systems. Extract, Transform, and Load (ELT) makes it easier for companies like yours to access data in disparate locations and move it to one centralized system.
In this episode of CDO Battlescars, Sandeep Uttamchandani, Unravel Data’s CDO, speaks with Keyur Desai, CDO of TD Ameritrade. They discuss battlescars in two areas: Building a Data Strategy and Pervasive Self-Service Analytics Platforms. Keyur is a data executive with over 30 years of experience managing and monetizing data and analytics.
In this episode of CDO Battlescars, Sandeep Uttamchandani, Unravel Data’s CDO, speaks with Keyur Desai, CDO of TD Ameritrade. They discuss battlescars in two areas: Building a Data Strategy and Pervasive Self-Service Analytics Platforms. Keyur is a data executive with over 30 years of experience managing and monetizing data and analytics.
The amount of big data generated around the world by the time you finish this page is limitless. Think about it for a second. Companies everywhere will create an innumerable amount of data right now — customer records, sales orders, chain reports, emails, you name it. Companies need all this data for data analytics — the science of modeling raw data to uncover precious real-time insights about their business. It's like opening a treasure trove.
In 1969, my aunt graduated from university and joined IBM, the dominant player in the nascent tech industry at the time. She remained at “Big Blue” where she met and married my uncle, and rose up through the management ranks, until their joint semi-retirement exactly 30 years later. She recently told me, “the only way you could get fired in those days was to murder someone, embezzle or steal”.
The Cloudera Data Platform (CDP) represents a paradigm shift in modern data architecture by addressing all existing and future analytical needs. It builds on a foundation of technologies from CDH (Cloudera Data Hub) and HDP (Hortonworks Data Platform) technologies and delivers a holistic, integrated data platform from Edge to AI helping clients to accelerate complex data pipelines and democratize data assets.
Once again, Yellowfin has been recognized in the Gartner Magic Quadrant. This is the eighth time we have been recognized and the second year we are in the Visionary Quadrant. As per our knowledge, Yellowfin is also the only Australian vendor to be included.
In a 2020 study performed by Nature Research, 70 different teams of neuroimaging experts were asked to test nine hypotheses by looking at the same MRI data set. You may not be surprised to learn that these teams reached a wide range of different conclusions, in part because no two teams chose identical workflows to analyze the data. With seventy teams, there were 70 different workflows.
Part of being a data professional is pretty simple... you notice when things don't add up. In my case, my Apple Watch and my Peloton aren't on the same data page when it comes to calorie tracking. In this blog, I'm going to deduce why I think it's happening and use Qlik and the Peloton/Apple metrics as the data to support my conclusions.
In what feels like a lifetime ago now, way back in 2012, the Harvard Business Review called out the role of data scientist as the sexiest job of the 21st century. Almost a decade later, does that still ring true?
From the rise of real data to the death of the dashboard, we pull out our crystal ball to give you the biggest trends and predictions hitting analytic & BI teams in 2021.
Almost a year into the pandemic, the accelerated digital transformation has begun to feel less abrupt and more sustained. 2021 looks likely to be defined by a new phase: Thriving on digital transformation, rather than just surviving through it. We’ve written about the changes forced on the traditionally risk-averse insurance industry by COVID-19.
Being in business for over 20 years, I’ve seen different approaches to selling take hold and become effective over time. One of the things that I’ve noticed through COVID is how important relationship selling is - and will be in the future.
The new 2021 Gartner Magic Quadrant for BI and Analytics report is out, and you can find it here! Gartner’s brand, alongside its breadth of research by its analysts, ensures that it’s a key reference document for clients in buying situations. No wonder, then, that every year the industry anxiously awaits where dots will fall on that famous 2x2 matrix. Therefore, I’m delighted to announce that Qlik is a Leader, again, for the 11th year in a row.
Factors to consider when evaluating an external scheduler for Fivetran data syncs.
With 42 percent of Americans still working from home, we're using TVs for more than just Netflix. These viewing screens double up as dynamic digital dashboards, displaying powerful SaaS metrics that power your business. Whether you're working from home or the office, turning your TV into a SaaS KPI dashboard is simple. Five tools are all you need. This guide shows you how to bring business metrics to the small screen with your very own custom SaaS KPI dashboard.
Version Control is a critical component of any software development team, particularly if you're collaborating with a large group of individuals. When done right, Version Control will help you track changes over time, like scheduling specific versions to accommodate the development of new features and bug fixes. You can even rollback to a specific version with ease as you continue testing.
A cornerstone to any successful SaaS business is great customer support. At Xplenty, one of our four key pillars is ‘Providing Fanatical Support’. For those of you who have been fortunate enough to work with our amazing Support team, you will know that they always go above and beyond to deliver fanatical support.
Needless to say, 2020 was an unforgettable year in a lot of ways and we were all happy to say goodbye to it. The pandemic has ushered in new ways of how we conduct businesses, remote work cultures, telehealth, grocery/food deliveries, etc. While certain industries were hard-hit by this change, most of the businesses were able to adapt, pivot, and take on this adversity in their stride.
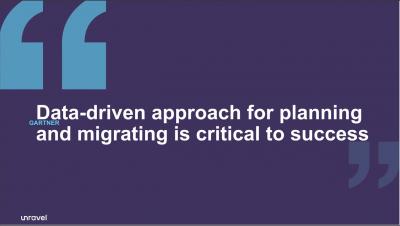
The past 10 months have accelerated the race to cloud. That’s all the more reason to pause and check that you’re moving in the right direction. Cloud migration these days is something of a no-brainer. For most businesses, it’s no longer a question of whether to migrate to cloud. The real issues are around the how, when, what, where and even the why of cloud.
Snowflake continued expanding its platform capabilities at the start of the new year, adding updates to data sharing, Snowsight, and data pipelines that help customers and partners access, mobilize, and share their data for better data-driven outcomes. Here’s a brief rundown of some of the exciting announcements from January 2021.
The partnership will simplify end-to-end integration, improving operational efficiency and increasing revenue for our customers.
The President of the USA has a 100 days to prove himself. You only have 90 if you have taken over a new leadership position. If you can’t build a suitable positive new momentum during this time, there might be hard work ahead of you or your leadership might even be doomed to failure. — The First 90 Days: Proven Strategies for Getting Up to Speed Faster and Smarter
Five differences between Stitch vs. MuleSoft vs. Xplenty: Organizations of all types need to pull data from disparate locations for data analysis. But the average company draws data from over 400 sources, making data integration difficult. Imagine if a technology could compile data from locations such as in-house databases, cloud-based apps, and SaaS and move it all into a centralized location. Extract, Transform, Load (ETL) makes this possible.
In the previous blog post, we looked at some of the application development concepts for the Cloudera Operational Database (COD). In this blog post, we’ll see how you can use other CDP services with COD. COD is an operational database-as-a-service that brings ease of use and flexibility to Apache HBase. Cloudera Operational Database enables developers to quickly build future-proof applications that are architected to handle data evolution.
The transportation industry has reached an inflection point – one in which nearly all forms of travel have been met with unprecedented challenges. Transit and airport revenues have been decimated with the lack of passengers, while freight and shipping companies have been overwhelmed with demand from an explosion of e-commerce orders. Despite facing unprecedented challenges, the industry is facing an equally unprecedented opportunity to innovate.
Service Level Agreements (SLAs) are commitments given to customers in relation to the product or service being provided. If breached, not only are organizations expected to compensate through penalties and credit fees, but they can also face a significant dip in brand reputation and loss of customer trust. This is why preventing SLA breaches is a top priority for any customer-facing organization. To stay on top of breaches, agents traditionally check the ticket status of each incident manually.
We dare you to go to your mobile device and search for a health and wellness app already installed. Truth is, even if you did not actually download it, your operating system most likely came with at least one app like that. Now, you might have chosen to delete such an app, in which case, we lost the dare. But it does not deny the fact that your mobile device, the very one that lets you shop, communicate, work, or travel, has just as much potential to assist in your well-being.
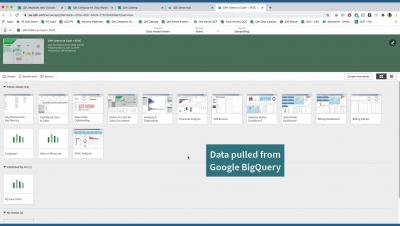
As the owner of Analytics, Monetization and Growth Platforms at Yahoo, one of the core brands of Verizon Media, I'm entrusted to make sure that any solution we select is fully tested across real-world scenarios. Today, we just completed a massive migration of Hadoop and enterprise data warehouse (EDW) workloads to Google Cloud’s BigQuery and Looker.
Extract, Transform, Load technology sits between your data source and its destination in your data stack. It’s a useful way of delivering data from multiple applications, databases, and other sources to your CRM, data lake, or data warehouse for analysis and use. But how do you know that it’s time to add ETL to your organization’s data stack?
According to a recent press release by the National Retail Federation, “nearly seventy-three percent of consumers celebrating Valentine’s Day this year feel it’s important to do so given the current state of the pandemic.” The release also states that “consumers still feel it’s important to spoil their loved ones in light of the pandemic.” We couldn’t agree more on the importance of celebrating the day.
When Kudu was first introduced as a part of CDH in 2017, it didn’t support any kind of authorization so only air-gapped and non-secure use cases were satisfied. Coarse-grained authorization was added along with authentication in CDH 5.11 (Kudu 1.3.0) which made it possible to restrict access only to Apache Impala where Apache Sentry policies could be applied, enabling a lot more use cases.
With automation becoming more user-friendly and streamlined than ever before, it's understandable organizations across sectors are examining how it can enhance their analytics capability and accelerate their business shift toward digital transformation.
Many BigQuery users ask for database triggers—a way to run some procedural code in response to events on a particular BigQuery table, model, or dataset. Maybe you want to run an ELT job whenever a new table partition is created, or maybe you want to retrain your ML model whenever new rows are inserted into the table. In the general category of “Cloud gets easier”, this article will show how to quite simply and cleanly tie together BigQuery and Cloud Run.
In Part 1 we learned how to set up our Xplenty pipeline to work with Chartio and prepared the data source. In Part 2, we will focus on using the data Xplenty provides in the Chartio platform. If you're new to Chartio, you can read through their QuickStart docs (shouldn't take more than 5-10 minutes) to gain some familiarity.
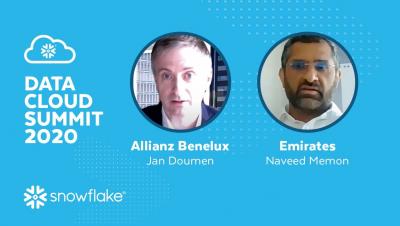
Snowflake met with Jan Doumen, Head of Expertise for Allianz Benelux, and Naveed Memon, Program Director, Data and Analytics for Emirates, at Data Cloud Summit 2020. Read excerpts from the conversation to learn how capturing data insights in the Data Cloud brings value to their businesses. Data’s value in the 21st century is often compared to oil’s value in the 18th century. It can transform organizations, opening doors to unprecedented opportunities.
Democratization of data within an organization is essential to help users derive innovative insights for growth. In a big data environment, traceability of where the data in the data warehouse originated and how it flows through a business is critical. This traceability information is called data lineage. Being able to track, manage, and view data lineage helps you to simplify tracking data errors, forensics, and data dependency identification.
The importance of effective data analytics within an organization is widely accepted by business leaders at this point. With use cases for data analysis spanning every department—from IT management, financial planning, marketing analytics, and so on—the right data analytics tools can have a significant impact on a company’s profitability and growth.
Five differences between Stitch, Talend, and Xplenty: Organizations store data in many destinations, making that data difficult to analyze. Legacy systems, SaaS locations, in-house databases, apps, you name it — by storing data in all kinds of places, companies can complicate data analytics considerably. Storing data in a warehouse or a lake makes more sense.
Cloudera Operational Database is now available in three different form-factors in Cloudera Data Platform (CDP). If you are new to Cloudera Operational Database, see this blog post. And, check out the documentation here. In this blog post, we’ll look at both Apache HBase and Apache Phoenix concepts relevant to developing applications for Cloudera Operational Database.
Today’s customers have a growing need for a faster end to end data ingestion to meet the expected speed of insights and overall business demand. This ‘need for speed’ drives a rethink on building a more modern data warehouse solution, one that balances speed with platform cost management, performance, and reliability.
Are you tired of slow dashboards? It’s a problem we hear end-users of BI tools complain about time and time again. Whether you’re an end-user or on the data team that the end-users blame, slow dashboards suck! With many BI tools now offering their own connectors and lightweight data transformation/preparation layers, slow dashboards are a common pain point across all organizations.
We’re seeing an increase in demand for hybrid AI deployments. This trend can be attributed to a number of factors. First of all, many enterprises look to hybrid solutions to address data locality, in accordance with a rise in regulation and data privacy considerations. Secondly, there is a growing number of smart edge devices powering innovative new services across industries.
No, not really. You probably won’t be rich unless you work really hard… As nice as it would be, you can’t really predict a stock price based on ML solely, but now I have your attention! Continuing from my previous blog post about how awesome and easy it is to develop web-based applications backed by Cloudera Operational Database (COD), I started a small project to integrate COD with another CDP cloud experience, Cloudera Machine Learning (CML).
The digital revolution is making a deep impact on the automotive industry, offering practically unlimited possibilities for more efficient, convenient, and safe driving and travel experiences in connected vehicles. This revolution is just beginning to accelerate – in fact, according to a recent Applied Market Research study, the global connected car market was valued at $63.03 billion in 2019, and is projected to reach $225.16 billion by 2027, registering a CAGR of 17.1% from 2020 to 2027.
This is part 2 in this blog series. You can read part 1, here: Digital Transformation is a Data Journey From Edge to Insight
inReality provides an analytics platform that leverages IoT sensor data (for example, visual technologies) to bring operational excellence and exceptional customer experiences to all types of venues. The company’s clients range from public schools to major telecommunication companies with the goal being to make their spaces more secure and efficient, to solve problems, and to create better experiences for their patrons.
Every new decade sees businesses split into winners and losers as technology evolves, competitiveness tightens, and new market entrants challenge the incumbents.
Off-the-shelf customer data platforms have serious shortcomings. Consider data warehouses instead.
Xplenty provides features to efficiently extract, transform, and store data from various sources. Chartio provides Visual SQL features that let us explore and analyze data. Furthermore, it includes functionality to arrange charts and metrics in dashboards that can be shared. Both these tools can be used synergically. In this post, we will cover how you to configured Xplenty to use Chartio data. In a subsequent post, we will explain how to visualize the data provided by Xplenty in Chartio.
Financial services institutions need the ability to analyze and act on massive volumes of data from diverse sources in order to monitor, model, and manage risk across the enterprise. They need a comprehensive data and analytics platform to model risk exposures on-demand. Cloudera is that platform. I am pleased to announce that Cloudera was just named the Risk Data Repository and Data Management Product of the Year in the Risk Markets Technology Awards 2021.
Artificial intelligence (AI), automation and machine learning (ML) are rapidly transforming the analytical experience for everyday business users in 2021. Whether it’s automated visualizations, continuous analysis, or reduced time-to-insight, there are many practical benefits of augmented analytics that are well documented and fully realized today.
You may have read about Snowflake’s IPO last year. But you probably didn’t hear about all the work that the Snowflake security team did in preparation. Our corporate security program went through a security analytics review to ensure that it satisfied the new security policy requirements resulting from the IPO. Here are a few lessons that we learned when setting up automated security control validation on our Snowflake security data lake.
Keep the bigger picture in mind as you build and use your analytics dashboards. Between devices, websites, applications, online service providers, and platforms of all kinds, modern businesses rarely have a single data source to analyze in our continuously connected world. That’s why how information is presented is almost as important as the quality of the information itself, making the difference between leading with confidence or simply flying blind.
When you’re providing APIs to your customers, you want to ensure they are getting value from them. At the same time, the best APIs are designed to be fully automated without requiring human intervention. This can leave your customers in the dark on whether your API is even being used by the organization and if you’re meeting any SLA obligations in your enterprise contracts.
Businesses today have a growing demand for real-time data integration, analysis, and action. More often than not, the valuable data driving these actions—transactional and operational data—is stored either on-prem or in public clouds in traditional relational databases that aren’t suitable for continuous analytics.
Continuous evaluation—the process of ensuring a production machine learning model is still performing well on new data—is an essential part in any ML workflow. Performing continuous evaluation can help you catch model drift, a phenomenon that occurs when the data used to train your model no longer reflects the current environment.
The data lakes concept has come back into popular focus with Amazon Athena, an innovative, serverless solution. But does it fit into your organization’s data stack? This article covers Amazon Athena capabilities, pros and cons, competitors, and use cases.
COVID-19 vaccines from various manufacturers are being approved by more countries, but that doesn’t mean that they will be available at your local pharmacy or mass vaccination centers anytime soon. Creating, scaling-up and manufacturing the vaccine is just the first step, now the world needs to coordinate an incredible and complex supply chain system to deliver more vaccines to more places than ever before.
Innovative organizations need DataOps and new technologies because old-school data integration is no longer sufficient. The traditional approach creates monolithic, set-in-concrete data pipelines that can’t convert data into insights quickly enough to keep pace with business. The following trends are driving the adoption of Hitachi’s Lumada DataOps Suite.
Thanks for all those who enthusiastically responded to my first blog post on Qlik analytics with Peloton! Now, onward brave souls as we learn HOW I was able to create the analytics I wrote about earlier!
How can you tell when your organization needs to start building a modern data stack? Orchard Analytics provides technical data team services on flexible contracts. Reach out to Phil to learn more. The software abundance problem created the need for data tools, and now -- surprise -- there’s an abundance of data tools.
How vulnerable is your sensitive data? Your data policies may put this information at risk of being breached. An ad hoc approach for dealing with this data makes it difficult to maintain your organization’s cybersecurity. Data obfuscation holds the key to improving your security and making it easier to use your data, but it must be driven by your policies to be effective.
Are you asking yourself the question “what is no-code”? You’re not alone. The concept sounds almost too good to be true: developing your own software applications without ever having to learn a programming language like Java or Python. Even your most technophobic employee can become a star software developer thanks to the proliferation of no-code development tools.
In the previous posts in this series, we have discussed Kerberos, LDAP and PAM authentication for Kafka. In this post we will look into how to configure a Kafka cluster and client to use a TLS client authentication. The examples shown here will highlight the authentication-related properties in bold font to differentiate them from other required security properties, as in the example below. TLS is assumed to be enabled for the Apache Kafka cluster, as it should be for every secure cluster.
While originally a crisis response to enable business continuity, flexible work options are starting to define the modern workplace. Organizations around the world were thrust into digital transformation almost overnight, but it looks like the trend of remote working arrangements is going to continue in 2021.
Combining the best of data lakes and data warehouses.
If you're a developer trying to ETL data into and out of Heroku, the seemingly shortlist of options may disappoint you. Heroku itself promotes Heroku Connect, but this expensive solution might not even integrate with all the systems you use (like AdWords and Facebook), making it difficult to get a holistic view of your data. Fortunately, Heroku Connect isn't the only solution. In fact, there are several third-party ETL tools that can help you get your data in and out of Heroku with ease.
One of the key pieces of work that we've done this past year is to actually build a completely bespoke application, so that we could properly look at the different ways that we could embed Yellowfin. This has helped us create a really unique customer experience within a third-party application. Like all great stories, our vision fundamentally changed on that journey, and we learned three valuable lessons as we built this application we want to share with you.
As a result of overwhelming excitement (and pressure) from my fellow Qlikkies, I’m going to share with you the recent demo I did at our all-company annual kick-off which shows Active Intelligence in action. It was intended to be an “internal-only” demo because it mixes existing capabilities with near-term future ones, but, on reflection, I think you, too, will be just as excited.