What's the difference between webhooks and APIs when it comes to integrating applications and systems with each other? elastic.io explains it in this 22 seconds adorable animation.
There is a separate video on the creation of your first integration flow, which discusses the topic in a little bit more detail. Here, we run through it rather quickly as part of the overall first steps on the platform immediately after a signup.
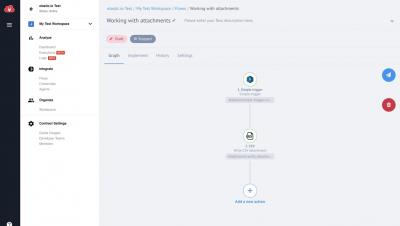
If you need to work with an attachment – create or send one – there are several connectors that support that. Don’t be confused by what you see now, Simple Trigger is not one of them, but I’m using it here to send some information along the flow. Now what I’m really looking for is the CSV connector, and here I’m using it to create – or, in fact, write a CSV file as an attachment.
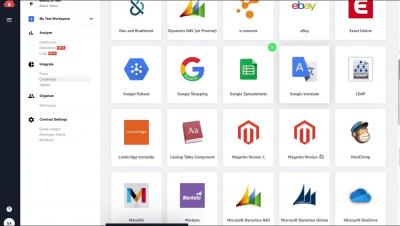
To explain the usage of our content-based router that enables you to add some business logic to your integration flow, let’s imagine that I have received a Google Spreadsheet file with unsorted leads data, for example, from downloading a coupon on a website. To convert these leads to customers, I’d like to offer them something of interest with a specifically targeted campaign based on the country of residence. For that, I need to filter and split the list.
With the code component, you can add any type of code and therefore, create your very own, custom connectors. It’s dead simple to use – it is already provided with some default code for reference, which you can, of course, delete and replace with yours.
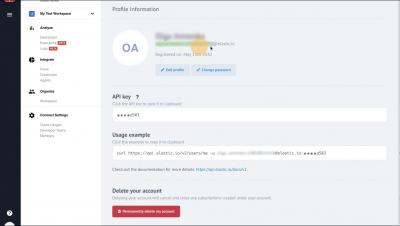
In this video, I’m working with our REST API connector to connect to our own elastic.io Integration Management API. We offer several ways to authenticate an API depending on its configuration. Here we take basic authentication with username and password. Now with the elastic.io API, the username is actually the email address you registered with. You can navigate to the Profile Information page to copy it from there.
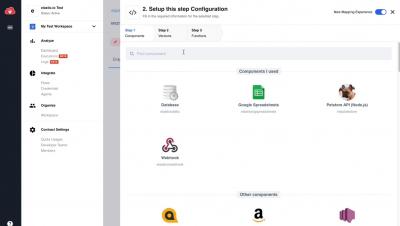
To start working with a MySQL, PostgreSQL, Oracle or MSSQL database, all you need to do is to select our Database connector. We have already learned from the short video on credentials that there are quite a few fields to fill in when you need to connect to a database for the first time. The data you see me enter here is merely from our test database.
As always, we start with giving our flow a meaningful name. Now let’s add a webhook. There are four authentication options for a webhook on our platform, just visit our documentation to learn more about it, but to keep it short and simple,
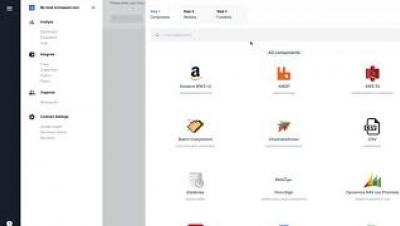
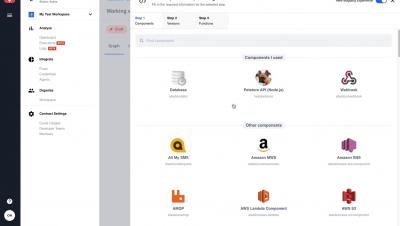
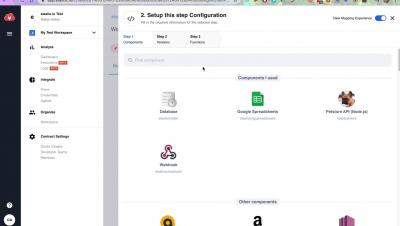
To use most of the available connectors you require to enter some sort of credentials to verify the account you want to access with a connector. You can add your credentials while setting up an integration flow as I’m doing it here on the example of the pet store connector.
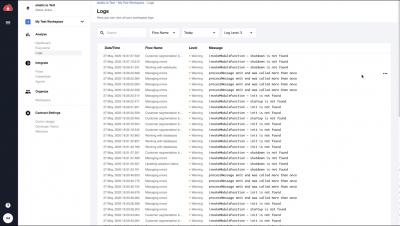
You can see if any of your flows have errors as soon as you log in to your dashboard. It shows you the number of records processed in total – in green – and the number of records with errors – in red. You can also see the same information if you click on the corresponding flow from the dashboard. In my case, you can see I have three records processed and all three returned errors.