
Systems | Development | Analytics | API | Testing

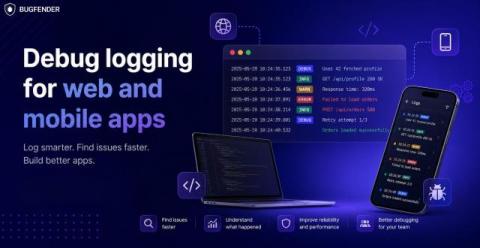
Debug logging for web and mobile apps

Debug logging is a particular form of logging that records detailed information about how an application behaves during execution, so we can identify, understand, and fix issues. This guide will give you a rookie-to-pro guide to debug logging, showing you: By the end, you will have a clear, practical approach to using debug logs effectively in real applications.

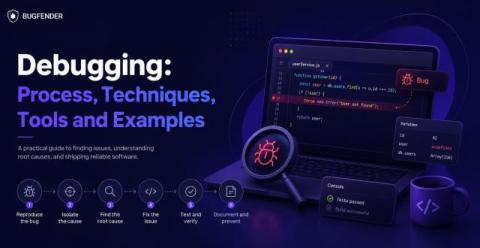
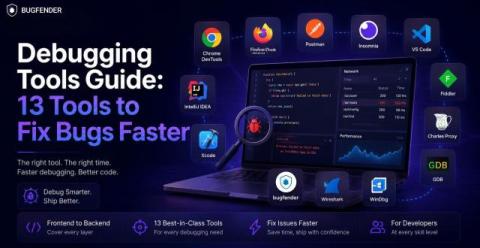
Debugging Tools Guide: 13 Tools to Fix Bugs Faster

Debugging tools have evolved from rudimentary catch-all software into specialist solutions for different languages, userbases and development stages. The best debugging strategies choose the right tool for their specific use case, and this guide will help you do that. We’ll give you the knowledge to: We’ll mention our own product in this list, but don’t worry: the content you’ll find here is impartial, comprehensive and educational, not salesy.

Debug a Node.js Memory Leak in Minutes with AI-Powered Heap Snapshot Analysis

Memory leaks are among the most frustrating production issues to investigate. At first, everything looks normal. Requests are processed successfully, users aren't reporting problems, and the application appears healthy. Then memory usage starts climbing. Garbage collection runs more frequently. Performance degrades. Eventually, the process becomes unstable or crashes altogether. Detecting a memory leak isn’t even half the battle.

How We Designed a Node.js Production Debugging Experience with AI

Earlier this year, our team launched the N|Solid Extension, a Node.js production debugging and observability tool designed for modern development environments. The goal was simple: help developers investigate production issues without constantly switching between dashboards, monitoring platforms, and their editor. Instead, runtime telemetry, diagnostics, security insights, and AI-assisted workflows could live directly where developers already spend most of their time.

The debugging agent for developers: runs locally and eliminates PR slop

The Multiplayer debugging agent is purpose-built for developers working with coding agents. It captures all the data observability tools miss and manages the whole process from bug identified to bug fixed. AI coding assistants are great at writing code. They are not great at fixing bugs in production and the reason is simple: they don’t have runtime visibility.

The Friction with Today's Debugging Strategies

Debugging has always been part of the craft. But in today’s systems — distributed, asynchronous, and increasingly opaque — debugging is no longer just difficult. It’s fragmented. Despite better tooling, more telemetry, and the rise of AI-assisted workflows, many developers still experience the same core frustrations when trying to understand what’s actually happening in production.

Automatic Sourcemap Retrieval in Production: Debugging Without the Friction

If you’ve ever debugged a Node.js application in production, you’ve likely seen this: Sourcemaps were supposed to solve this. And technically, they do. But in practice, most teams still struggle to make sourcemaps available when they’re actually needed.

Why User-Friendly Testing Platforms Matter for DevOps Teams in 2026

Ask any DevOps lead where their team loses time, and the answer isn’t “We just need one more automated test.” The real drag on DevOps velocity comes from the convoluted testing platforms teams are forced to wrestle with. While automation and AI integrations are often promoted as the solution, complexity quietly strangles productivity long before code hits production.

iOS Crash Debugging: How to Find and Fix App Crashes

It goes without saying that crash debugging is crucial. For app quality, for App Store ratings, for compliance with Apple’s ecosystem. And if you’re new to the concept of debugging (or you simply want to top up your knowledge) this guide will give you a complete toolkit of tips and instructions. We’ll explain the most common iOS crash debugging scenarios and show you how to diagnose and fix them quickly.

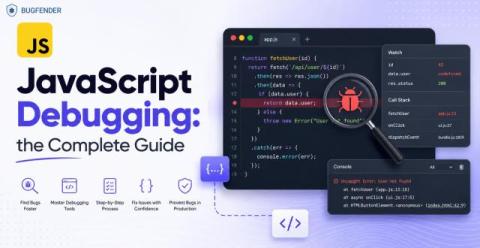
JavaScript debugger Statement: How to Use It and When

The JavaScript debugger statement is a built-in keyword that tells the JavaScript engine to pause execution at a specific line of code. When execution stops, you can inspect variables, function scope, and the call stack using developer tools. It is commonly used during development to analyze how values change and where logic breaks, without relying on repeated logging or assumptions. No more guesswork. No more partial truths.