|
By Benjamin
Learn more about one of the most important levers for optimal PHP performance. OPcache provides support for byte-code caching of PHP scripts. For a dynamic language such as PHP, a byte-code cache can increase the performance significantly because it guarantees a script is compiled only once. OPcache has been bundled with PHP as a loadable extension since PHP 5.5. Starting with PHP 8.5 OPcache is an integral part of PHP and always installed, but not necessarily always enabled.
|
By Diana
We’re rolling out a new wave of improvements across Tideways in our first Release of 2026, focusing on deeper visibility, smarter automation, and broader ecosystem support. From automatic tracepoints for selected transactions and improved exception workflows to enhanced FrankenPHP worker-mode instrumentation, these features continue to reduce manual effort while increasing observability.
|
By Benjamin
In the blog post about Fine-Tuning OPcache Configuration I mentioned the thundering herd problem that affects OPcache during cache restarts. When OPcache is restarted, either automatically or manually, all current users will attempt to regenerate the cache entries. Under load this can lead to a burst in CPU usage and significantly slower requests.
|
By Benjamin
How does your Shopware 6 store’s PHP backend performance compare to other operators of Shopware in general? To answer this question, we have aggregated and anonymized performance data from over 200 Shopware 6 stores over the second half of 2025 and computed benchmark numbers to compare to for the most important page types: Product details, Category, Search, and Homepage. We previously made these benchmarks for 2025 Q1, and 2025 Q2. Going forward, these will be published every 6 months.
|
By Tobias
Big optimizations in PHP’s memory consumption have become exceedingly rare. Since then, memory improvements have been smaller in scope, focusing on little details for certain types of variables. Like improving the Garbage Collector (GC) in edge cases, which Iljia Tovilo contributed to PHP 8.5 titled “Mark enums and static fake closures as not collectable”.
|
By Diana
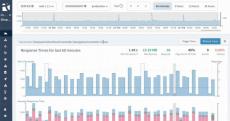
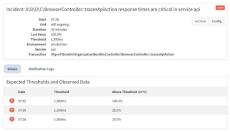
In our fourth Release of 2025, we included PHP 8.5 support on the day of its release and Heartbeats to monitor your application’s pulse more closely than ever. If something is offbeat, you’ll receive timely alerts. We improved alerting by introducing fine-granular transaction level response time and made automatic tracepoint triggers more powerful.
|
By Benjamin
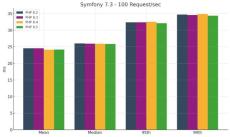
Each year, right on schedule, a new version of PHP is released at the end of November. So, how much faster is this new release across popular frameworks and applications? Our tests show that, in general, the performance between 8.2, 8.3, 8.4 and 8.5 does not move much for a Laravel, Symfony and WordPress demo application. Moving to the newest PHP version isn’t a magic shortcut to better performance. Not everything is bleak, though.
|
By Benjamin
The close of 2025 is near, and that also means a new version of PHP is about to be released: 8.5! There has already been some discussion regarding the latest features and modifications affecting developers, for example on Laravel News, PHP.Watch or the Zend Blog. In this post we are highlighting just the performance, debugging, and operations-related changes in PHP 8.5 that you will not find in the posts listed above. Several of these changes were even contributed by Tideways employees.
|
By Tim
We are noticing that some of our requests are starting to get slow and server load increases. Checking the process list of our server, for example with htop reveals that our FPM workers are taking up all of our CPU time. Checking the health with our basic toolset of lsof to show open network connections and strace to show syscalls does not reveal any activity. This means that the workers are spending time processing data without any externally visible activity.
|
By Benjamin
The database is often the source of performance problems in PHP applications, but there are many different reasons why this is the case. The most straightforward is that individual queries that the application issues are slow, due to their inefficient structure, by not using indexes or other coding mistakes. But for MySQL databases, a common problem is also the misconfiguration of the server itself.
|
By Tideways
Making an application scale is generally seen as something that only the most magical of developers can do, but it is easy once you have the correct tools. Fortunately for us, these tools are freely available online! In this talk, we will look at a few available options to learn what our applications are actually doing, help identify bottlenecks, and fix them so we can move on to the most important part of any project: delivering features.
|
By Tideways
How to use Tideways with XHProf UI to profile PHP code in Drupal VM.
- March 2026 (1)
- February 2026 (2)
- January 2026 (1)
- December 2025 (1)
- November 2025 (5)
- October 2025 (1)
- September 2025 (3)
- August 2025 (5)
- July 2025 (1)
- May 2025 (3)
- April 2025 (3)
- March 2025 (1)
- December 2024 (1)
- November 2024 (3)
- October 2024 (2)
- September 2024 (1)
- August 2024 (2)
- June 2024 (2)
- April 2024 (1)
- March 2024 (2)
- February 2024 (1)
- December 2023 (1)
- November 2023 (1)
- August 2023 (1)
- April 2023 (1)
- January 2023 (1)
- December 2022 (1)
- November 2022 (1)
- October 2022 (1)
- September 2022 (1)
- June 2022 (1)
- May 2022 (2)
- March 2022 (1)
- November 2021 (1)
- September 2021 (1)
- August 2021 (1)
- July 2021 (1)
- May 2021 (1)
- February 2021 (1)
- November 2020 (1)
- August 2020 (1)
- May 2020 (1)
- March 2020 (2)
- February 2020 (3)
- January 2020 (2)
- December 2019 (1)
- November 2019 (1)
- October 2019 (3)
- June 2019 (1)
- May 2019 (1)
- January 2019 (1)
- August 2018 (4)
- June 2018 (3)
- December 2017 (1)
- October 2017 (1)
- August 2017 (2)
- April 2017 (1)
- February 2017 (1)
Tideways saves you time by taking the guesswork out of your app's backend performance. Gain detailed insights, spot performance bottlenecks, and get real-time error detection alerts.
Experience your application from the customer’s point of view. Your team can find broken code, see where slow load times occur, and get notified when an error is detected or a page crashes - all from within one tool.
Spend more time shipping and less time stuck on bottlenecks:
- Monitoring + Alerting: See where there’s room to improve your app’s user experience through detailed performance insights. Spot changes in trends over time and get alerted whenever something’s not right.
- Profiling: Gain full visibility into your code to uncover any slowdowns via traces - collected every minute - or trigger traces yourself for any request that you need more information on.
- Error + Exception Tracking: Identify and create fixes for issues caused by new or previously unseen fatal errors and uncaught exceptions.
Your mission control center for PHP application performance.


