How to Load Test RESTful APIs with LoadFocus
In order to learn how to test your APIs, especially how to load test your APIs, let’s first find out some essential info on APIs and RESTful APIs.


In order to learn how to test your APIs, especially how to load test your APIs, let’s first find out some essential info on APIs and RESTful APIs.
Standard Deviation is an important metric in performance testing analysis and informs us how stable the application under test is. In other words, it tells us if the requests that occur during the test are consistent or not. Standard Deviation measures how the response times are spread out around the average response time (mean). A small standard deviation means that the response time of all the requests are close to each other.
Automate Load Testing with Jenkins CI/CD Plugin From LoadFocus https://loadfocus.com/.
Install the Jenkins Load Testing plugin from https://plugins.jenkins.io/loadfocus-loadtest/
Load Testing: https://loadfocus.com/load-testing
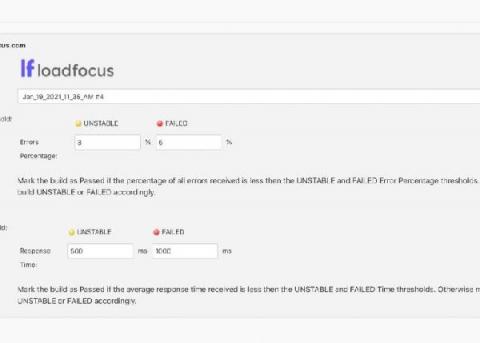
We’ve released a new version of our load testing plugin for Jenkins CI. Load Testing CI/CD Plugin helps to run load tests automatically as a Post-build action and mark the build as PASSED, UNSTABLE or FAILED based on errors received during the test run and the average response time. Use the Post build actions and define your load test limits in order to mark the build UNSTABLE or FAILED.
If you haven’t heard of Apache JMeter, then here is a short intro on what is it and how it works. We’ll keep this article short and jump straight to the list of top reasons to use Apache JMeter: Apache JMeter has a GUI for designing test scenarios, however the command-line is used for actually running the tests (run your JMeter tests in the cloud with JMeter Load Testing tool from LoadFocus).
Whenever I get asked why do I need load testing or why is load testing so important, over and over again I come up with this simple example. Let’s say that you send an email campaign to 10,000 subscribers of your website/blog. What will happen to your website if 1000 subscribers open the email they’ve just received and the email is super interesting and they decide to click the action button in the email, link which will take them back to your website.
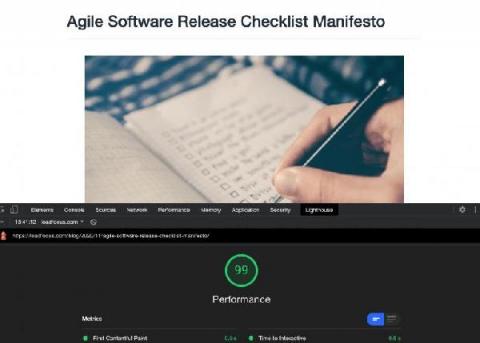
We managed to get a 99/100 Performance Score with Google Lighthouse, check the details below how we did it. Read more on how to run a Google Lighthouse audit. First of all, you’ll need to install a list of WordPress plugins, activate and configure them. This will manage your JS, CSS assets and minify the HTML for all pages. JavaScript Options We’ve only ticked the two options here: CSS Options HTML Options Misc Options 2.
Cumulative Layout Shift or CLS, Web Vitals and Core Web Vitals, these terms seem complicated, but it’s actually not that hard to understand what they stand for.
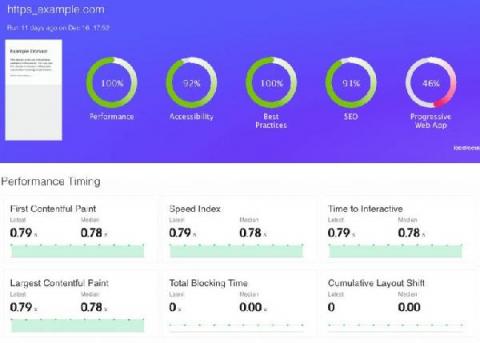
If you know nothing about your customers’ experience with your website, Google Lighthouse might be the right tool for you. Google Lighthouse is an open source automated website auditing tool from Google, used for discovering issues and opportunities to improve the overall user experience of your website.
The execution order of the elements in an Apache JMeter performance test plan is very important, it helps understand the timeline of events and how your test will behave. Make sure that you understand every JMeter element before adding it to your test plan, this will help create faster performance tests and not jump into various errors.