Systems | Development | Analytics | API | Testing
Cloudera
Streaming Ingestion for Apache Iceberg With Cloudera Stream Processing
Recently, we announced enhanced multi-function analytics support in Cloudera Data Platform (CDP) with Apache Iceberg. Iceberg is a high-performance open table format for huge analytic data sets. It allows multiple data processing engines, such as Flink, NiFi, Spark, Hive, and Impala to access and analyze data in simple, familiar SQL tables.
A UI That Makes You Want to Stream
To get the most out of any application, a graphical user interface improves your efficiency and data streaming without exception. A UI should help you through the steps of an often-complex flow as the visible layer between your problem and solution. Even the most hardcore back end enthusiasts will admit that its significance is undeniable for a complete product. It has to be well organized and easy to understand, yet be able to provide the right tools in the right place.
Transaction Support Using Apache Phoenix
Leveraging Data Analytics in the Fight Against Prescription Opioid Abuse
Every day in the US thousands of legitimate prescriptions for the opioid class of pharmaceuticals are written to mitigate acute pain during post-operation recovery, chronic back and neck pain, and a host of other cases where patients experience moderate-to-severe discomfort.
Implementing and Using UDFs in Cloudera SQL Stream Builder
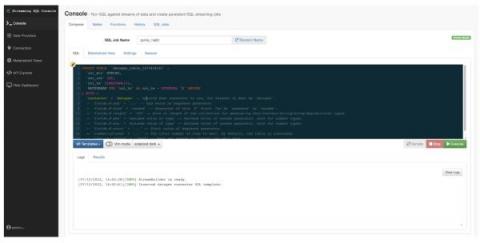
Cloudera’s SQL Stream Builder (SSB) is a versatile platform for data analytics using SQL. As apart of Cloudera Streaming Analytics it enables users to easily write, run, and manage real-time SQL queries on streams with a smooth user experience, while it attempts to expose the full power of Apache Flink. SQL has been around for a long time, and it is a very well understood language for querying data.
SQL Streambuilder Data Transformations
SQL Stream Builder (SSB) is a versatile platform for data analytics using SQL as a part of Cloudera Streaming Analytics, built on top of Apache Flink. It enables users to easily write, run, and manage real-time continuous SQL queries on stream data and a smooth user experience.
Spark Technical Debt Deep Dive
Once in a while I stumble upon Spark code that looks like it has been written by a Java developer and it never fails to make me wince because it is a missed opportunity to write elegant and efficient code: it is verbose, difficult to read, and full of distributed processing anti-patterns. One such occurrence happened a few weeks ago when one of my colleagues was trying to make some churn analysis code downloaded from GitHub work.
How Banks are Using Technologies to Help Underserved Communities
Financial inclusion, defined as the availability and accessibility of financial services to underserved communities, is a critical issue facing the banking industry today. According to the World Bank, 1.7 billion adults around the world do not have access to formal financial services, meaning that they cannot open a bank account or access credit, insurance, or other financial products.
How the Public Sector Can Maximize the Value of Dark Data
Have you ever considered how much data a single person generates in a day? Every web document, scanned document, email, social media post, and media download? One estimate states that “on average, people will produce 463 exabytes of data per day by 2025.”


