Systems | Development | Analytics | API | Testing
Tideways renews its commitment to sponsoring the PHP Foundation
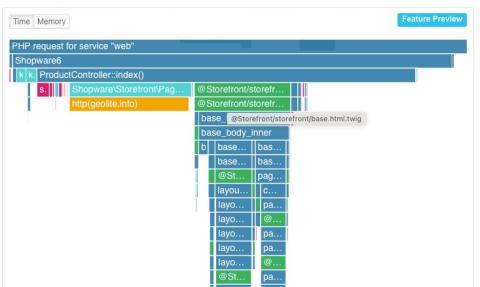
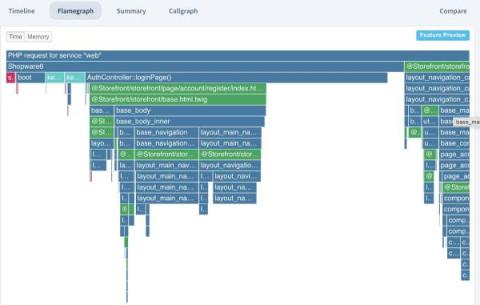
Flamegraph Feature Preview Christmas Present, Thank you for 2023!
As a Christmas present, we have started rolling out a new feature for the Profiler: flamegraph rendering in addition to the existing Timeline and Callgraph. This is a feature preview and will see more changes in Q1 of 2024. For now, only customers with the most recent plans (Tideways 6) can access them, or you can view them in traces of the „demo“ organization. Let us know what you think of it!
Tideways 2023.2 Release
Since our last release announcement in April we have been working on a number of new features for Tideways that we are now happy to share with you. This is the second and final release for 2023. From here the team will be looking ahead to 2024, the 10th anniversary of Tideways’ launch, and preparing some amazing new features and improvements.
The PHP stat cache explained
90% of the time when I explain how the stat cache works in PHP, people are surprised because they expected it to work differently. It was invented to solve a very limited problem when you call several file system related operations on the same file in quick succession. Why should you know how it works? Because sometimes you need to work around the cache with the clearstatcache() function to get PHP code to run without errors.
Tideways 2023.1 Release
In the 4 months since the last release (2022.4), we have been working on a number of new features and improvements that we are pleased to share with you today as part of our 2023.1 release of Tideways. In addition to the new features, we also revamped our pricing and plans at the end of March under the umbrella of “Tideways 6”. The main difference is that all plans now include all features and are now limited by transactions as the primary metric. Summary.
PHP Performance in 2022: A Year in Review
Now that 2022 is over, its time to review newsworthy topics about performance in the PHP language. As this is the first time we are doing this type of blog post, please let us know your thoughts about this format and if we forgot important topics.
A story of Lazy Loading File System Operations for better dev system performance
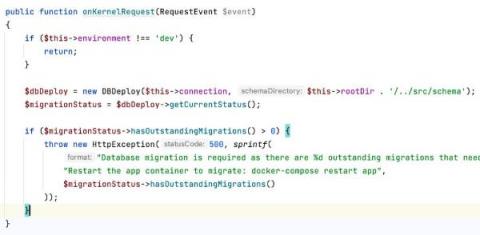
In this blog post I want to share a story of a performance bottleneck using the filesystem that we experienced in our development setup. In the Tideways backend, we have a simple homegrown database migration tool that scans a directory for.sql files and applies them if not already done. It is a very old piece of code that I used since before the times of doctrine/migrations. It is much simpler but works for us.
Tideways 2022.4 Release
This post contains a comprehensive list of all the features that we worked on and deployed over the last 3 months, all included in this 2022.4 release.
Journey of Profiling a Slow Development Setup
While working on the migration from Vagrant to Docker with Compose in our development setup, we were seeing extremely slow responses in the browser and I immediately made a mistake to assume I know the problem without measuring. A story in 7 acts.


