Systems | Development | Analytics | API | Testing

Latest Videos

Challenge Accepted! Ask Mike What You Want to See in His Next Video

We are asking Qlik Nation members what tips and tricks they want to see in Mike Tarallo's upcoming Qlik shorts or Do More with Qlik - Tips and Tricks edition series. This is your opportunity to submit what Qlik capabilities, features, solution you want to learn more about - and see them featured on YouTube and other social platform.

AI: Balancing Innovation and Ethics

In a Sky News Australia Segment, Qlik CEO Mike Capone discusses the the transformative power of #AI. Here's a glimpse of our discussion: Ethical AI & Public-Private Collaboration: Emphasized the urgent need for public-private partnerships in setting ethical AI standards. The recent developments from Davos are a promising step towards this vital collaboration.

#shorts - Sankey Chart - There's a better Viz for that

The Sankey chart (Sankey chart) lets you add a specific type of flow chart to the sheet you are editing. The chart visually emphasizes major transfers or flows within defined system boundaries. The width of the chart arrows is shown proportionally to the flow quantity. The Sankey chart is included in the Visualization bundle.

Harness the Power of Outcomes: Solve Problems, Drive Success

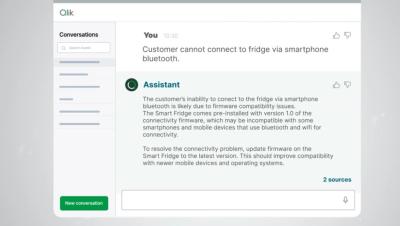
You will see how Qlik works where and how you work, whether you are on a computer or mobile device You will see how I use AI and conversational analytics to collaborate in real-time with my colleagues to get context to help me explore my business problem further and how I can take action on my findings immediately by notifying and integrating with my valued partners, all from one platform. I even use a little generative AI with Amazon Bedrock as a fun example to show you the art of the possible.

SaaS in 60 - Key Driver Analysis

This week we introduce Key Driver Analysis, a new capability that leverages the power of Qlik AutoML to surface the most influential factors that are driving an organizations outcomes in their analytics. Users can simply right click on a chart to initiate a key driver analysis and then specify a target measure and specific features they want to include. The AutoML engine will then generate an analysis that shows the fields in your data model that are most affecting the target measure, complete with visualizations and Natural language generated insights.