
Systems | Development | Analytics | API | Testing

How to create a monthly executive report with AI (Databox Executive Decision Brief)

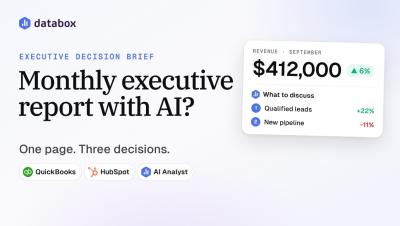
How do you create a monthly executive report with AI? Run the Executive Decision Brief skill in Databox. Genie, the Databox AI Analyst, reads your connected metrics and writes a one-page leadership brief: the executive takeaway, wins, risks, contradictions between metrics, and three "Should we..." decisions to discuss. It reads in about 90 seconds, and the same skill runs in Claude through Databox MCP.


How to create a weekly GA4 report with AI (free Databox GA4 report skill)

How do you create a weekly GA4 report with AI? Run the free GA4 Website Traffic & Performance Report skill in Databox. Genie, the Databox AI Analyst, reads your live Google Analytics 4 data and writes the whole weekly report: the verdict, channels, landing pages, conversions, trends and anomaly flags. The same skill also runs in Claude through Databox MCP. In this video: Chapters Key terms Tools and data sources shown: Google Analytics 4, Facebook Ads, Asana (Asana MCP connector), Slack, Claude with Databox MCP. All data is a fictional demo account.
How to Measure the Impact of a Product Launch With AI and Your Notion Specs

To measure the impact of a product launch, grade it against the target written in its spec. Every launch spec names a metric, a target and a time window. Once the window closes, the launch either hit that target or missed it. Before then, it’s too early to call. The hard part is getting the target and the result into the same view, because the target lives in Notion and the result lives on your dashboard.

Why did our pipeline drop? How to find the cause in your HubSpot deal notes with AI

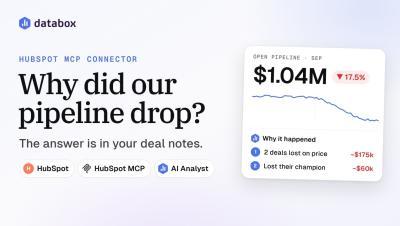
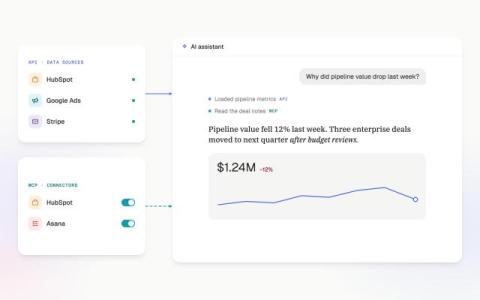
Open pipeline drops when deals leave it (closed won, closed lost or pushed out of the period) or when fewer new deals come in. Your CRM dashboard shows which of those happened. The reason behind it sits in HubSpot, in the notes, emails and call logs on the deals themselves. To find it in one question, ask an AI analyst that can read both. With the HubSpot MCP connector, Genie, the Databox AI Analyst, traces the drop to the deals behind it and tells you what the reps wrote about them.

MCP vs. API: What's the difference for AI analysis?

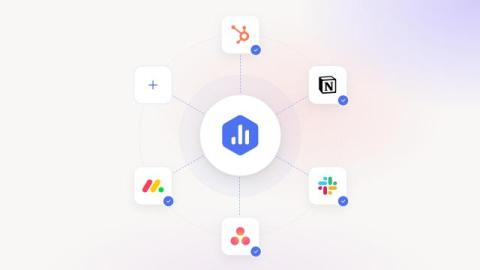
Businesses have long used APIs to connect their software applications and exchange data. These connections power many of the tools companies rely on for reporting, allowing them to bring information from different systems into one place and keep their reports up to date. Now, AI assistants like ChatGPT and Claude can connect to those same business applications through MCP (Model Context Protocol), making it easier to access information and perform tasks using natural language.

Why Did My Organic Traffic Drop? How to Find the Cause With AI and Your Semrush Data

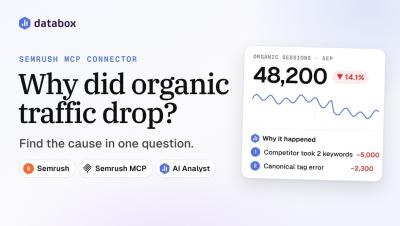
Organic traffic usually drops for one of four reasons: a competitor took your rankings, keywords slipped out of the top 10, a technical issue appeared on your site, or you lost backlinks. Your SEO dashboard shows when the drop started. The reason sits in Semrush, split across Position Tracking, Organic Research, the backlink reports and the site audit. Finding it means opening four reports, exporting four files and lining them up against your traffic chart in a spreadsheet.

Why did our pipeline drop? Find the cause in HubSpot deal notes (Databox HubSpot MCP)

Why did our pipeline drop? Ask Genie, the Databox AI Analyst, and it reads your HubSpot deal notes through the HubSpot MCP connector to find the cause. In this example, open pipeline is down 17.5% to $1.04M. Genie traces it to 2 deals lost on price after a Sept 1 rate change and 1 deal that lost its champion. In this video: Chapters Key terms Tools and data sources shown: HubSpot (CRM integration and HubSpot MCP connector), Google Analytics, Stripe, Slack. All data is a fictional demo account.

Why did my organic traffic drop? Find the cause with AI (Databox Semrush MCP)

Why did my organic traffic drop? Ask Genie, the Databox AI Analyst, with the Semrush MCP connector. Genie checks your Google Analytics traffic, then runs keyword, competitor, backlink and site audit research in Semrush, all in one answer. In this example, two causes explain almost the whole 14% drop: a competitor took two top keywords, and a canonical tag error went live with a site release. In this video.

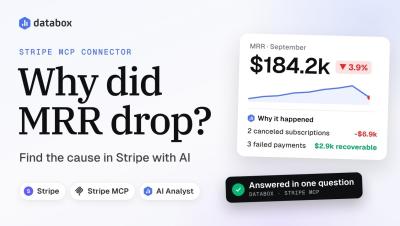
Why did MRR drop? Find the cause in Stripe with AI (Databox Stripe MCP connector)

Why did MRR drop this month? Connect Stripe to Genie, the Databox AI Analyst, with the Stripe MCP connector and ask. Genie checks the MRR metric in Databox, then reads the subscriptions, invoices and payments in Stripe. In this demo, two canceled subscriptions and three failed payments explain the whole 3.9% drop, and $2,900 of it is still recoverable. In this video: Chapters.

Marketing Root Cause Analysis: Using AI to Diagnose Why Performance Dropped (and What It Leaves Out)

Your dashboard already told you ROAS dropped. The expensive question is why, and answering it means correlating data across platforms, isolating variables, and testing hypotheses against the numbers. Done by hand, that is an afternoon per incident. Done by AI, it takes seconds, with one catch.

New: Give Your AI Analyst the Context to Explain Performance and Help You Take Action

You open your performance dashboard and notice that your sales pipeline has dropped 15% since last week. You can see the decline, but the numbers alone don’t explain what caused it. Maybe several deals were pushed into next quarter, your team lost a major opportunity, or a campaign generated fewer qualified leads than expected. The answers are likely somewhere in your CRM, project management tool, or conversations your team has been having.

Best Sales & CRM Dashboard Software: 9 Tools Ranked

Most roundups of sales dashboard software rank features. The useful ranking question sits one level deeper, in your own stack. In Databox’s Time to Insight: What Are the Biggest Roadblocks to Actionable Data? survey, 75.68% of teams named their CRM as a primary reporting data source, and 73.13% of the same respondents named data spread across multiple sources as their biggest reporting challenge. Both numbers describe the same team.

New: Automate Recurring Analysis And Reporting With Routines

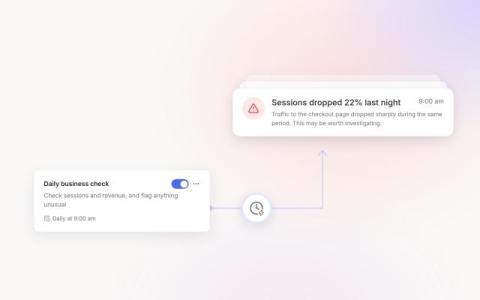
Performance analysis only happens when someone has the time to do it. Every team has performance reviews that need to happen on a regular cadence, whether that is reviewing channel performance each week or reporting to clients every month. The focus may change, but the work behind them is often very similar. Someone needs to understand what changed, why it changed, and whether anything needs attention. Then they need to turn those findings into an update and get it to the people who need it.