|
By Monise Branca
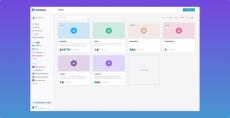
“Which MRR metric should I be looking at?” “What’s the best dashboard to track our sales performance?” “Where can I find our marketing goals?” Sound familiar? As we spoke with our customers to learn more about how they collaborate around data, we kept hearing the same challenges – growth creates a need for better data management. What starts as a few key dashboards and metrics quickly becomes hundreds, spread across different teams, projects, and platforms.
You wouldn’t run a business without tracking revenue, so why treat your social media strategy any differently? Every post, ad, and campaign needs to be backed by data—not just gut instinct. However, there’s a problem with accurate tracking… social media platforms simply throw out an overwhelming amount of data, and not all of it matters.
|
By Špela Jurič
According to Slack, over 82% of people agree that feeling happy and engaged at work is the key driver of their productivity. This proves that workplace satisfaction is about more than just keeping employees content. It’s a critical factor in driving organizational success. Companies with satisfied employees regularly outperform their competitors, which proves that a happy workplace is a strategic advantage.
Are your PPC ads delivering results or just draining your budget? With the average conversion rate for PPC ads sitting at just 3.2%, it’s clear that success in 2025 will require more than basic tracking or blind spending. The difference between wasted ad spend and soaring ROI often comes down to the tools you use to analyze performance. That’s why PPC analysis tools are the backbone of any successful campaign.
|
By Jeremiah Rizzo
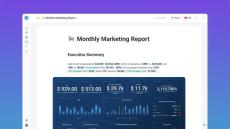
It helps you make better decisions. Don’t get me wrong, saving 12~ hours every month is great. But the biggest value is the ability to gather stakeholders around the data, to help them see what performance was, what changed, and what to do next. That’s where the magic happens. You’re not just saving time. You’re focusing on improving key metrics together. Great reports help you find opportunities to improve, or address downward trends before they get worse.
|
By Databox
If you’ve followed SEO developments this year, you’re likely familiar with the buzz surrounding Google’s SEO leak back in March. These revelations have sent ripples through the content marketing industry, reshaping how marketers approach their strategies. At its core, the leak highlights something we’ve all suspected: SEO is evolving, and so must we. Gone are the days when pumping out endless content streams was the key to success.
Did you know that 52% of marketers say maintaining an active presence across multiple social media platforms was their biggest challenge in 2024? With billions of users across Instagram, LinkedIn, TikTok, and Facebook, the stakes for brands have never been higher. But trying to manage all these platforms without the right tools? That’s burnout waiting to happen.
|
By Databox
Whether you’re struggling to pinpoint why your bounce rate is off the charts, understand which pages drive conversions, or optimize the user journey, the right website analytics tool can make or break your strategy. But with countless platforms claiming to be the best, choosing one feels overwhelming. That’s why we’ve handpicked the top 15 website analytics tools for 2025 to help you track the metrics that matter and grow your business smarter—not harder.
|
By Databox
Far too many small businesses, especially those without internal digital marketing teams or those working with external marketing professionals or agencies, overlook one of the most critical aspects of a well-rounded SEO program: data-driven SEO. According to a recent Databox research, 67% of businesses handle content marketing and SEO internally, yet many may not be fully leveraging data to optimize their efforts.
|
By Databox
Marketing is like the complex blood system of the body. It has too many branches spreading into each and every area of the body. Some are thin, some are thick – but all are equally important for healthy functioning. Automation can help you cut down some of the work in this system and focus on those bigger, fatter arteries that supply blood directly to the heart of the business. It can help you run multiple campaigns at once and stay ahead of the competition.
|
By Databox
A motivated team is a winning team. When it comes to igniting drive in our teams, support and purpose are key to making our people feel like they can take on anything. Subscribe to our channel for more exclusive insights into life at Databox.
|
By Databox
The Databox Growth plan is designed for teams who need quick answers and for analysts who don’t want to be the bottleneck. We took powerful analytics tools you normally find in expensive BI tools, made them easy to use, and packed them into one plan. Then we added AI to help you get those answers even faster!
|
By Databox
Learn how to develop a "Growth Formula" for each Go-To-Market (GTM) motion.
|
By Databox
Learn how to build a marketing plan that aligns with your company’s goals, and helps ensure you hit your marketing targets. We’ll cover everything from working with sales and other teams, to identifying the “levers” you need to pull to have the best chance of hitting your target.
|
By Databox
Thanks for joining our exclusive live broadcast. Feel free to share your questions and interact with other participants in the chat.
|
By Databox
How many deals will you close next month? How many website sessions will you get? How many impressions will your social channels get? When you don’t know what your performance will be, it’s hard to set realistic goals, craft plans, or have the right team in place. Databox Forecasts helps you predict future performance so you can make more accurate plans now. In this video, you’ll learn: Bookmark this tab AND share the series with your entire company/team! Databox empowers everyone - leaders, managers, and individual contributors alike.
|
By Databox
Want to turn your data into growth? We are back with all-new Metric & Chill LIVE episodes hosted by Jeremiah Rizzo, Director of Product Marketing at Databox. What to Expect: Insightful talks with successful business leaders Actionable insights to improve performance Live shows where you can participate and ask questions Want to attend the LIVE show or get the episodes emailed to you? Sign up at databox.com/newsletter or subscribe to "Metrics & Chill" on your favorite podcast app.
|
By Databox
Forecasting Metrics and KPI Forecasting with Databox - a Predictive Analytics tool has never been easier. With Metric Forecast you can anticipate the future of your most important metrics, such as website traffic, sales revenue, or customer engagement. Adjust Forecasts for holidays, use confidence scores for reliability, and save forecasts to track performance. Say goodbye to guesswork in your digital metrics and start making more confident, data-backed decisions.
|
By Databox
While dashboards let you see real-time performance to answer “How am I doing right now?”, Reports take it a step further. With Reports, you can provide a more comprehensive view of your historical performance - with all the context - to your teams, clients, or stakeholders. In this video, you’ll learn: Bookmark this tab AND share the series with your entire company/team! Databox empowers everyone - leaders, managers, and individual contributors alike.
|
By Databox
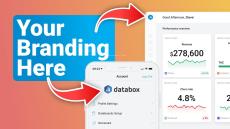
The Databox White Label Add-On provides you with your own Analytics platform, complete with dashboards, notifications, reports, and even a mobile experience. All accessible to you, in just a few clicks.
- February 2025 (3)
- January 2025 (4)
- December 2024 (2)
- November 2024 (5)
- October 2024 (8)
- September 2024 (9)
- August 2024 (8)
- July 2024 (3)
- June 2024 (4)
- May 2024 (1)
- April 2024 (5)
- March 2024 (6)
- February 2024 (4)
- January 2024 (7)
- December 2023 (5)
- November 2023 (12)
- October 2023 (11)
- September 2023 (21)
- August 2023 (6)
- July 2023 (6)
- June 2023 (8)
- May 2023 (5)
- April 2023 (4)
- March 2023 (10)
- February 2023 (5)
- January 2023 (5)
- December 2022 (2)
- November 2022 (11)
- October 2022 (5)
- September 2022 (9)
- August 2022 (20)
- July 2022 (22)
- June 2022 (21)
- May 2022 (21)
- April 2022 (21)
- March 2022 (20)
- February 2022 (21)
- January 2022 (18)
- December 2021 (24)
- November 2021 (22)
- October 2021 (20)
- September 2021 (24)
- August 2021 (9)
- July 2021 (13)
- June 2021 (14)
- May 2021 (4)
- April 2021 (7)
- March 2021 (10)
- February 2021 (11)
- January 2021 (10)
- December 2020 (4)
- November 2020 (4)
- October 2020 (12)
- September 2020 (10)
- August 2020 (7)
- July 2020 (8)
- June 2020 (4)
- May 2020 (5)
- April 2020 (8)
- March 2020 (9)
- February 2020 (2)
- January 2020 (8)
- December 2019 (6)
- November 2019 (9)
- October 2019 (6)
- September 2019 (4)
- August 2019 (4)
- July 2019 (8)
- June 2019 (4)
- May 2019 (1)
- April 2019 (4)
- March 2019 (2)
- February 2019 (7)
- January 2019 (6)
- December 2018 (2)
- November 2018 (5)
- October 2018 (11)
- September 2018 (4)
- August 2018 (3)
- July 2018 (3)
- June 2018 (3)
- May 2018 (3)
- January 2018 (1)
- March 2017 (1)
- November 2016 (1)
Databox pulls all your data into one place, so you can track performance and discover insights in real-time.
Databox is an app that serves as a personal data assistant, helping business users pay attention to what matters, when it matters. From a morning briefing that makes sure you start the day knowing where you stand and how you’re progressing towards your goals, to smart alerts throughout the week that let you know when something needs your attention, Databox makes sure you’re never in the dark about the data that matters most to you. With Databox, you can focus on driving results -- not putting out fires.
Do you know how your data performed today?
- Track everything all in one place, from any device: Connect all your data sources to track all your company’s performance in one place, from any device. Just one login to track Google Analytics, HubSpot, Salesforce, Facebook Ads, Google AdWords, and 50+ others.
- Launch beautiful dashboards, no coding required: Choose from our library of pre-made templates, or create your own dashboard using our drag and drop editor, and have beautiful, real-time visualizations of your data in minutes.
- Focus more on the metrics that matter: Set goals and monitor progress in real time so your whole team can spot issues as they happen and make the adjustments needed to stay on target.


