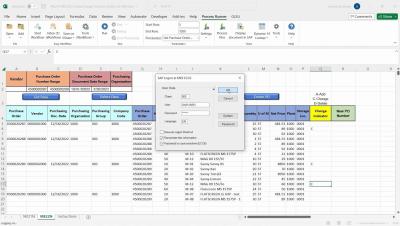
Systems | Development | Analytics | API | Testing

July 2023

Angles Professional: Operational Reporting for Deltek from insightsoftware

Speed-up operational report production with ready to go software including pre-built content that meet the needs of those on the Netsuite ERP. With direct, multi-source connectivity and drag-and-drop editing, you have everything in hand to self-serve interactive reports and dashboards to support day-to-day decision making.

Angles Enterprise for SAP: Unlock the Insights in Your SAP ERP Data

Angles Enterprise for SAP (formerly Every Angle) from insightsoftware transforms and enhances your critical data from SAP ERP tools (including ECC and S/4HANA), turning it into actionable business insights. Angles puts the power of operational analytics and business intelligence into the hands of the people who need it most – business users.

Partners in Innovation: Voice of the Customer Enhancements to Logi Symphony

It’s no secret that companies that listen to their customers have a greater chance at success. That is why we value our customers’ voice at insightsoftware. You use our products every day to run your organization, make critical decisions, achieve your business goals, and bring success to your own stakeholders. This approach provides you with a unique perspective on how our offerings can be enhanced with new features and tools that help you and your end users work better.

Let Real-Time Data Visualization Drive Your Storytelling

Stories are the crux of effective communication. According to a Stanford University study, nearly two-thirds of people remember a story that’s part of a presentation. The study also found that speakers who merely present facts and figures only achieve a 5% recall rate among their audience. When your customers deliver analytics and reporting, the data visualization experience should be a memorable one.

Comparing Data Visualizations: Bar vs. Stacked, Icons vs. Shapes, and Line vs. Area

Great data visualizations have the power to persuade decision makers to take immediate, appropriate action. When done well, data visualizations help users intuitively grasp data at a glance and provide more meaningful views of information in context. Good data visuals give busy workers a high-level summary of important data. They also offer a big-picture perspective and highlight trends, anomalies, and outliers while giving users the option to drill down into details and ask new questions when needed.

Why Finance Teams are Struggling with Efficiency in 2023

The results are in–for the third year in a row, insightsoftware has partnered with Hanover Research to deliver our yearly Finance Team Trends Report. Comparing results across the years shows an incredible journey for finance teams across the globe. The survey included 519 senior accounting and finance professionals across North America and Europe, the Middle East, and Africa (EMEA). 52% are located in North America while 48% are in EMEA.