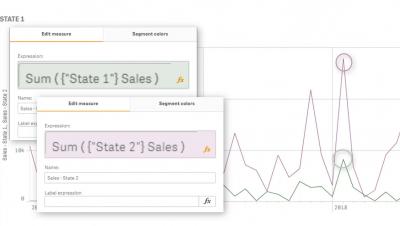

It’s time to get back to my favorite topic in visualization – how to best use color. I’ve written about it before in two of my previous posts, which you can read by clicking here and here. But, for this post, I’m going to go into a bit more detail on some tips and tricks that you can use.
If “necessity is the mother of invention,” COVID-19 forced many businesses around the world to rethink their digital transformation, data and analytics strategies. Out of every crisis, there will be opportunities. Although the current pandemic has certainly acted as a black swan event in some cases impeding progress, it has, nonetheless, accelerated several of the trends already pushing toward a digital future.
Qlik is excited to announce the June 2020 product release, furthering our leadership in augmented intelligence, best-in-class visualization and platform extensibility.
The ingredients of competitive advantage and differentiation tend to evolve over time. Throughout history they have included access to capital, raw materials, labor; they have been based on economies of scale and economies of scope. At IDC, it is our contention that the new basis for differentiation will be economies of intelligence.
We all know visualization alone is not enough in the world of modern BI. And, when Qlik Sense was introduced, we focused on building a world-class platform, driven by our associative engine, open APIs and modern architecture. Our vision was to drive all the major analytics use cases, and support a lightning fast pace of innovation for the next decade and beyond.