Systems | Development | Analytics | API | Testing

Development

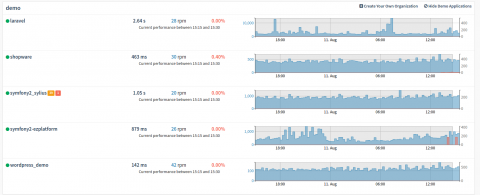
Improved Dashboard with Preview Chart and Recent Performance Metrics

We have improved the dashboard in Tideways to include preview charts with the last 24 hours of performance data and the performance of the most recent 15 minute interval. This provides you with a much better overview of all your applications and by selecting any time range in the preview chart you can directly jump to a time-range that interests you.

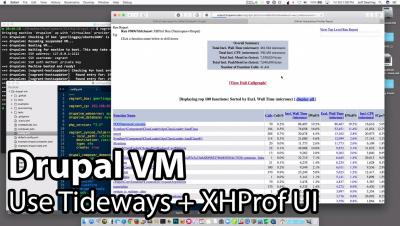
Profiling Your PHP Application - Michael Heap - php[tek] 2016

Making an application scale is generally seen as something that only the most magical of developers can do, but it is easy once you have the correct tools. Fortunately for us, these tools are freely available online! In this talk, we will look at a few available options to learn what our applications are actually doing, help identify bottlenecks, and fix them so we can move on to the most important part of any project: delivering features.

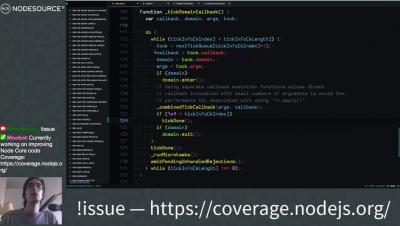
Need to Node: Introducing Node js v6 LTS Boron

With the Node.js v6 “Boron” LTS release slated for October, users of the LTS releases have the opportunity to get a release of Node.js with a slew of new features that will be supported as an active LTS release until April 2018, with maintenance for a year past that. Rod Vagg, Chairperson of the Node.js Technical Steering Committee (TSC), will be giving an introduction into Node.js v6 LTS and what this release will entail.