

Systems | Development | Analytics | API | Testing

What Private Equity Firms Need from a Portfolio Reporting Tool

Most portfolio reporting tools assume the data underneath them is already clean and comparable across every portfolio company. It rarely is. A fund with twenty portfolio companies usually has twenty different ERPs, twenty different charts of accounts, and a reporting team that spends the week before every LP update reconciling numbers by hand.

How to Feed Consolidated Financial Data into Power BI

Power BI is a reporting layer. It renders whatever data reaches it, but it doesn't harmonize a chart of accounts, eliminate intercompany transactions, or trace a number back to the journal entry across ten different ERPs. Keboola is the governed data foundation that does that work upstream, then feeds consolidated, audit-ready financials into Power BI. No rip-and-replace, no new reporting tool to learn.

Kai Has a Different Personality in Czech vs English

Anthropic recently published research showing that Claude behaves differently depending on the language you use. Not just translating differently. Actually expressing different values. In Arabic, Claude is warmer and more deferential. In English, it's more rigorous and cautious. In Russian, it challenges your assumptions more. When we read that, we had one question: does Kai do this too? So Jordan, our AI lead, analysed around 3,000 internal Kai sessions. The answer: yes.

The 2026 Finance Stack: Which Layer Are You Actually Missing?

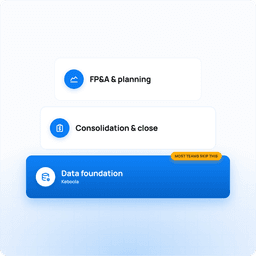
Most comparison guides in this space organise tools by feature count or analyst quadrant position. Neither is especially useful if you are a CFO trying to solve a specific problem under time pressure. The more useful diagnostic is category. Finance intelligence tools in 2026 fall into three distinct layers, and buying the wrong layer is the most expensive mistake you can make. Consolidation and close platforms are built to produce auditable, multi-entity financial statements.

What Happens When the CEO Can Always Get the Answer

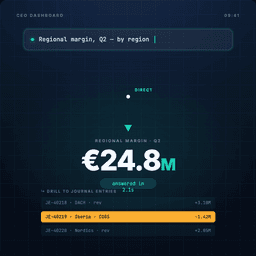
The goal is not complicated to describe. The CEO opens a dashboard, asks a question about regional margin for Q2, drills through to the underlying journal entries, and gets the answer in seconds, without asking anyone. No email to the controller. No waiting until Thursday. No 'let me come back to you on that.' Every CFO who has sat through a pitch for a data platform has been shown this vision. Most of them believe it is achievable. A meaningful number have actually achieved it.

Why Your Best Finance Analysts Are Leaving

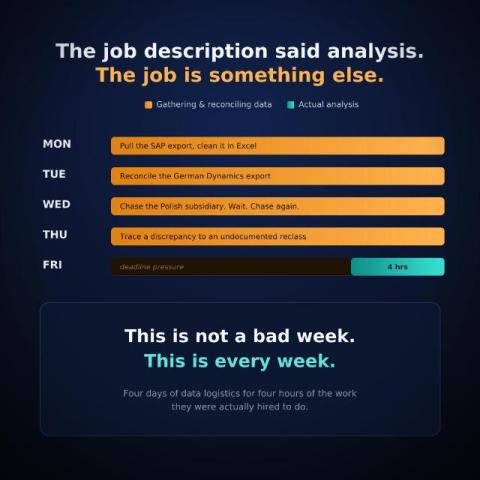
It is Monday morning. Your strongest FP&A analyst opens their laptop and starts pulling the SAP export. They clean it in Excel, cross-reference it against last month's version, and flag the columns that have shifted format again. Tuesday they pull the Dynamics export from the German entity and begin reconciling the two. Wednesday the Polish subsidiary data has not arrived. They chase the local accountant, wait, chase again.

The Frozen Excel Preference

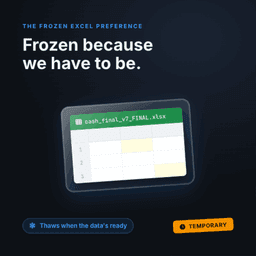
There is a pattern showing up in finance teams that almost nobody is writing about, because it runs counter to the narrative. Finance leaders at organisations with messy, ungoverned data have made a deliberate choice: they prefer working with a frozen Excel snapshot over connecting AI to their live financial data. Not because they are afraid of technology. Not because they distrust AI as a concept.

The First Deadline Nobody Warns You About

You are forty-eight hours into the role. The acquisition has closed. The press release went out. The operating partner has sent a congratulatory message and a list of reporting expectations. And somewhere in a credit agreement you are still reading, there is a covenant reporting deadline. It is in 45 days. It requires auditable numbers from a business you have not yet fully seen, running on systems you do not yet control, with a finance team you have not yet met.

Why Your Chart of Accounts Breaks at Every Acquisition

You closed the deal. The press release went out. Integration planning is underway. And somewhere in the finance team, a controller is opening a spreadsheet and starting to map 1,400 account codes from the acquired company's ERP into your group chart of accounts. This is the moment the chart of accounts breaks. Not dramatically. Not all at once.