Systems | Development | Analytics | API | Testing

Latest Posts

Grafana k6 v0.45.0 release: gRPC streaming support, cloud script updates without running tests and more!

Grafana k6 v0.45.0 has been released, featuring a new experimental module for gRPC streaming support, a new browser recorder extension for Firefox and Chrome, and tons of improvements for Grafana k6 OSS and Grafana Cloud k6. Here’s a quick overview of the latest k6 release and all the news from the community.

Compare Grafana k6 browser vs. Google Lighthouse for web performance testing

The Grafana k6 browser module simulates how users interact with a browser page and collects web performance metrics about the interaction. Since launching the module in 2021, we're frequently asked how it compares to Google Lighthouse as a tool to measure web page performance. This blog post compares k6 browser and Google Lighthouse from various perspectives.

Frontend vs. backend: How to plan your performance testing strategy

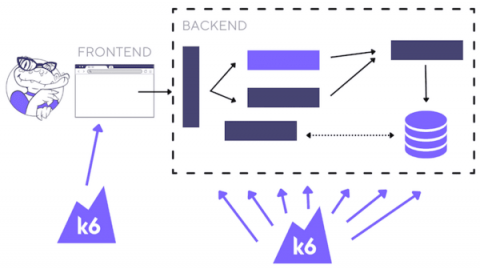
There are many aspects of application performance, but they broadly fall into two categories: frontend performance and backend performance. As a tester, it’s important to know the differences between the two and how that impacts the way you approach your tests. In this blog, I’ll provide a high-level overview of frontend performance testing and backend performance testing, including pros and cons of each one.

Chaos Testing: Building Resilience early in the development cycle

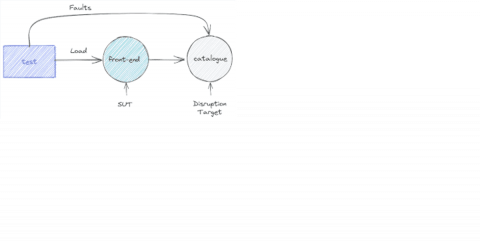
Modern applications are built on a microservices architecture that leverages cloud-native technologies. This architecture has many benefits regarding scalability and fault-tolerance of individual components, but it also increases the complexity of the applications, mostly due to the interdependencies between services. This complexity makes it difficult for engineers to fully understand how their applications will react to abnormal conditions, such as a dependency failure or performance degradation.

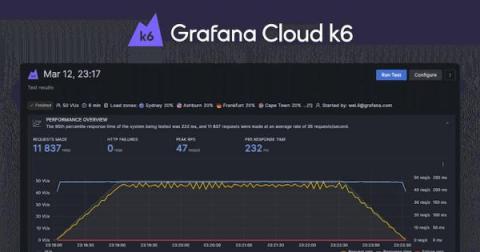
Introducing Grafana Cloud k6: unified performance testing and observability

Organizations use load and performance testing to prevent issues from impacting customers, which is essential if they want to stay relevant in today’s digital-first world. And with the rise of cloud native technology and DevOps, software teams must shift performance testing left, towards development. However, traditional load and performance testing tools simply haven’t kept pace, leaving developers, operations, and QA teams siloed.

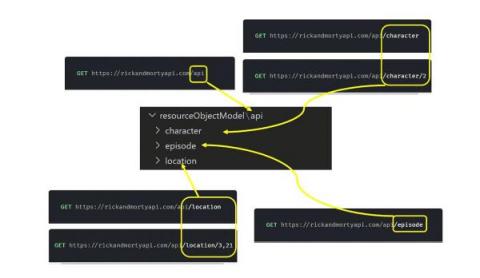
Load Testing Made Simpler with Resource Object Model

Load testing, which is as a type of non-functional testing that puts a structure or system under pressure and measures its response, might sound boring. In reality the entire process of planning, estimating, and implementing load tests against the system is like putting together pieces of a complex puzzle, and it can be a lot of fun.

k6 browser module

As of k6 version 0.43.0, xk6-browser is now bundled in k6 as an experimental module! 🙌 Since announcing xk6-browser in November 2021 at Grafana ObservabilityCON, the team have been busy adding on new features to include browser automation in k6. The interest from the community has also increased, which shows that browser automation and frontend performance is as important as backend performance.

Efficiently Tracking Frontend Performance with xk6-browser and Slack Integration

In this article, we will discover the process of sending custom metrics, provided to us through the xk6-browser, in order to gain a better understanding of our performance tests. Through the integration of these metrics, we will be able to create more tailored Slack messages that will help to manage our rule sets.

Pair Grafana Faro and Grafana k6 for frontend observability

Grafana Faro and xk6-browser are both new tools within the Grafana Labs open source ecosystem, but the pairing is already showing a lot of potential in terms of frontend monitoring and performance testing. Faro, which was announced last November, includes a highly configurable SDK that instruments web apps to capture observability signals that can then be correlated with backend and infrastructure data.