Systems | Development | Analytics | API | Testing

Yellowfin

August 2022 Yellowfin User Group Event Recap

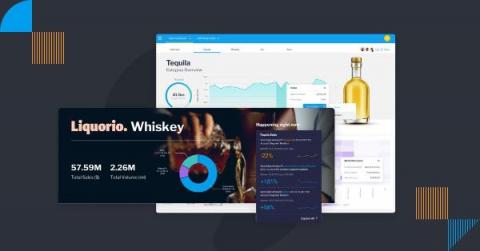
Welcome to our Yellowfin Customer User Group Event event recap for August 2022! Following our latest quarterly webinar, held August 9 -11, the Yellowfin team aims to provide a quick and handy summary blog for our customers that could not attend. Here, you can find a general update on the future product roadmap of the Yellowfin embedded analytics product suite, including Version 9.8, coming this September.

What is the Impact of Using a Business Analytics Dashboard?

It's common knowledge today that business intelligence (BI) dashboards are powerful tools that can help you track and analyze your business performance, identify trends and patterns, and make better decisions based on data, not gut feeling. There several benefits to using a business intelligence dashboard, and it can have a big impact on your business.

How to Choose the Best Data Visualization for Your Reporting

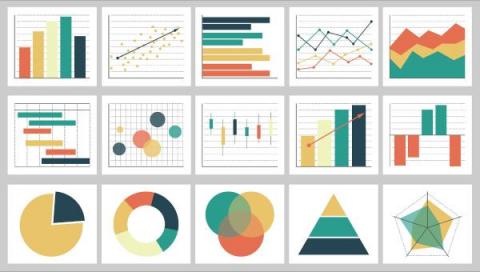
Data visualization involves visually imparting information to communicate complex data. Graphics such as charts help simplify data so more people can understand the insights embedded within a dashboard or report. Businesses use data visualizations to find and highlight patterns and trends in big data sets, with many data visualization examples available today, including graphs, maps and plots to help others grasp data conveniently.

Operational, Strategic or Analytical Dashboard: Which Type Is Best for BI?

In this modern era of digital transformation and big data, business intelligence (BI) dashboards have grown increasingly important in the improvement of business performance and growth of organizations. Dashboards enable you to easily identify and analyze key insights at a glance, and more accurately make important decisions. There are different types of dashboards to fit particular use cases and audiences, including the operational dashboard, strategic dashboard, and analytical dashboard.

8 Business Benefits of BI Dashboards

Business intelligence (BI) dashboards, also known as BI dashboards, are a powerful way to help people collect, share and analyze their business data to make informed decisions. Dashboards can help users monitor operations, optimize processes, and improve overall business performance by having data readily available, and can also help detect and prevent potential problems before they become issues with its use of real time data.

Dashboard vs Report: Which is better for BI?

Dashboards and reports are two common terms used interchangeably in discussion around business intelligence (BI) and data analytics platforms. Both are analysis tools used to present operational information graphically, provide visibility into organizational performance, and enable informed decision-making based on hard tracked metrics. But what is the actual difference between BI dashboards vs a report?

9 Key Features of Enterprise Data Visualization Software

Enterprise organizations with complex datasets, need to find ways to make their data more accessible and usable. One way to do this is through data visualization, which can help provide reporting that makes data more understandable and actionable. While the bare minimum requirement for data visualization BI software is good data visualization capability, there are more specific features that are often needed.

What is Data Visualization and its Importance in Business Intelligence?

Data visualization is synonymous with business intelligence. Like dashboards, it’s a core capability of analytics solutions, and it’s important to know its role in the BI process today. Data visualization is the practice of representing information graphically to communicate and contextualize data. It highlights important changes, patterns and trends using a visual format, such as charts, graphs, maps and plots, to help make data easier to understand.

12 Key Features of any Business Intelligence Solution

Editor's Note: This post was originally published in November 2010, and has been updated in 2022 for comprehensiveness, with 6 additional key BI features added. Different organizations will invest in a business intelligence (BI) solution for different reasons, depending on their specific circumstances and industry.

4 Key Features of a Modern BI Dashboard

The business intelligence dashboard, or BI dashboard, is a paradigm that’s well over 30 years old, and for many, it hasn’t evolved fast enough to address a fundamental limitation. Context. On its own, dashboards are a handy visualized report of key data pertaining to business performance, designed as a way to quickly consume important data at-a-glance.