Systems | Development | Analytics | API | Testing

Profiling

How to Choose the Best Performance Profiling Tools

You finish writing your code and launch your application. Then, you begin experiencing performance issues. How can you fix this? It doesn’t matter how talented your development team is, every code should always be analyzed, debugged, and reviewed to make it run faster. What you need is a performance profiling tool. In this article, you will learn about performance profiling and how to determine the best performance profiling tools for your software.

Profiling Schrödinger's Code

In modern software development and operations, everything can be monitored. This isn’t a matter of technology. If you want to monitor something, you can. However, modern monitoring tools come with a price, and while sometimes that price isn’t too high, at other times the cost can be unbearable. For example, an APM tool that monitors your server’s health with CPU and memory metrics is pretty cheap and non-intrusive.

Top 5 Python Memory Profilers

According to the Stackoverflow survey of 2019, Python programming language garnered 73.1% approval among developers. It ranks second to Rust and continues to dominate in Data Science and Machine Learning(ML). Python is a developers’ favorite. It is a high-level language known for its robustness and its core philosophy―simplicity over complexity. However, Python application’s performance is another story. Just like any other application, it has its share of performance issues.

Summer Release: Slow SQL Query Log, Callgraph Profiler, Memory Tracepoints

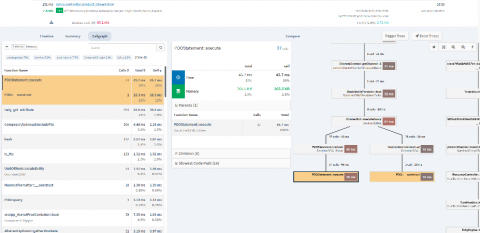
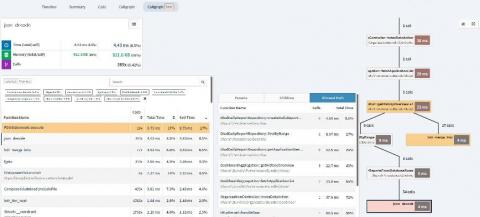
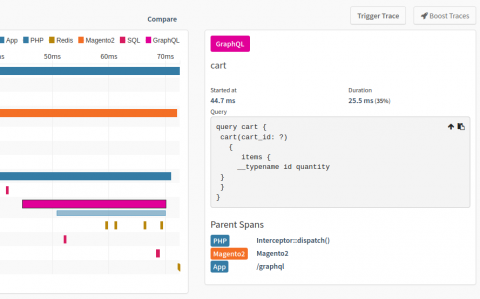
This Summer Release of Tideways builds on the previous Beta Announcements in May's Spring Release and marks the general availability of This new functionality is fully available by updating the Tideways PHP Extension to version 5.2.4 and the Daemon to version 1.6.18. In addition to rolling out new features, we also renamed the concept of "Application" in Tideways to "Project" and we provide a detailed explanation why at the end of this post.

New Feature: Multiple Production Environments in Pro License

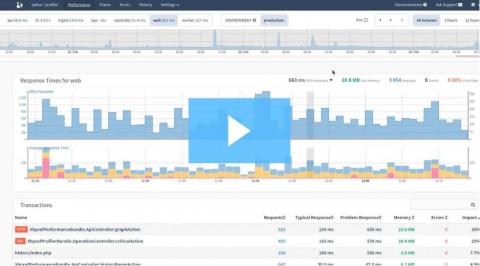
All Tideways applications with a Pro license can now create additional production Environments in addition to the one that is available by default. Configuring a second or more environments as "production" effects the retention and the traces/minute collected for these environments. By default non-production environments have just 1 day of retention and 1 trace/minute.

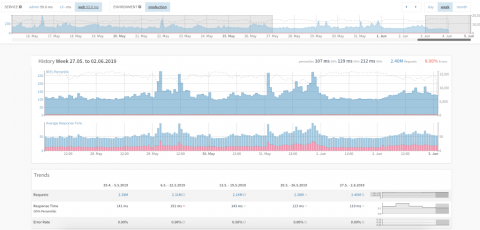
A New and Improved Application History

Tideways history functionality is still mostly based on the features available 4 years ago, before we introduced Services and Environments, Downstream Layers and many others. Time for a redesign of the history to include support for all the features and data that are available now. By using the UI elements from the performance overview our we also introduce a familiar look and feel, where the previous history screen used its own widgets.

Use Tideways for applications of all sizes with the new Flex plan

The PHP community is large and diverse in their approach to build and run PHP applications. We have seen hundreds of small applications running on a handful of servers and one product running on multiple clusters and hundreds of servers across the globe. Still, we believe all PHP applications regardless of size benefit from monitoring, profiling and exception tracking functionality.