Systems | Development | Analytics | API | Testing
Debugging
Rookout Named A Gartner Cool Vendor in Monitoring and Observability
We are honored to announce that Rookout, the world’s leading dynamic observability and debugging platform, has been recognized by Gartner as a Cool Vendor, based on the October 11 2021 report titled “Cool Vendors in Monitoring and Observability – Modernize Legacy, Prepare for Tomorrow” by Padraig Byrne.
Level Up Your Cloud-Native Debugging Experience
Debugging is hard. Cloud debugging is harder. Debugging Kubernetes and Serverless applications sometimes feels nearly impossible when: These classic remote debugging challenges have made the world of cloud debugging seem impossible at times and has given rise to the practice of Observability. The rise of the Observability trend in recent years has directed engineers towards one direction to solving these problems: print logs, print traces, throw exceptions.
Debugging a Node.js Application with a Production Debugger
Production debugging in its current form is a relatively new area of technology that aims to make it easier for developers to solve problems in their code. More often than not, we don’t have all the information we need to solve those hard to reproduce bugs. This leads to long hours of debugging, adding more log lines, and creating separate reproduction environments to try to isolate and reproduce problems.
Heisenbug 101: Guide to Resolving Heisenbugs
Welcome fellow developer, I can see you’ve traveled a long road, why don’t you stay a while and listen? I’ve got some fantastic stories to share; Lessons to imbue your debugging skills with power and wisdom, adding at least 1000 XP to take you to the next level and make your future travels much safer. Hmm, now, where should we start? Have you already faced the terrifying Heisenbugs? They are truly fantastic.
11 Best Tips to Node.js Debugging that You Didn't Know
When people hear the term "Node.js Debugging," they immediately think of the function "console.log()." They also assumed that's how pros debug Node.js applications. Nah!!! That's not good enough, mate. You'll need more than the console.log() function to debug your Node.js application like a pro. If the proper technique is not taken before testing, debugging a Node.js application might be difficult. Testing is an essential part of the development process for any application, software, or website.
It's Time To Turn On The Light With Dynamic Log Verbosity
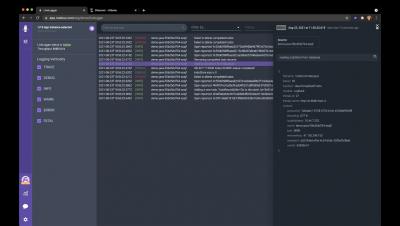
As we recently discussed, many of us are still lost in the darkness, grasping for a log line to shed some light on the issue we are trying to troubleshoot. Many of our customers and colleagues have shared the following challenges with us: But what if we didn’t have to make such a choice? What if we could easily and efficiently switch on exactly the logs we needed, without hurting our application?
Get To The Root Cause Faster With Rookout's Live Debugger - Now Available On The Azure Marketplace
We have recently launched our disruptive Live Debugger on the Azure Marketplace, making it easier than ever before for teams on the Microsoft stack to slash the time they invest in debugging. We are excited about this, as we have been working closely with Microsoft to make sure that both large international enterprises as well as smaller and scaling startups have direct access to Rookout, to make the most out of our dynamic observability solutions.


