Systems | Development | Analytics | API | Testing

Yellowfin

How to Build the Best Analytics Experience for Your SaaS Product

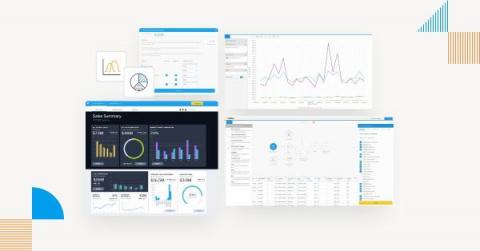
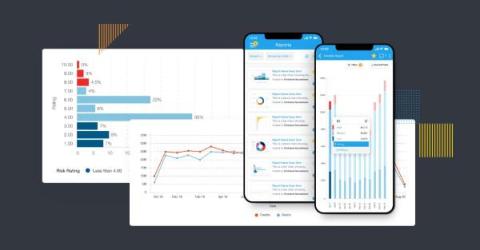
For any product team with a Software as a Service (SaaS) application, the significance of embedding capable, reliable analytics is well understood. But it’s important to remember how valuable these tools are for your users’ experience, too. Having fast access to data and easy ways to explore it is, as you know, key to monitoring business performance, finding trends, sharing insights, and improving your core product. Today’s business user also wants more when they use your product.

How to Create a Heat Grid in Yellowfin Dashboards

Welcome to the latest entry in Yellowfin Japan’s ‘How to?’ blog series! In our previous blog, we created a pie chart that aggregates on the basis of category. By using set analysis, we were able to represent the percentage of Books Only in the numeric display, based on the composition of the items ordered.

The Ultimate Guide to Retail Data Analytics

Whether you love, hate or remain indifferent towards data, it’s impossible to deny its importance in today’s business landscape. Businesses across all sectors and industries collect data and perform data analysis, to better understand their customers and business processes, in an effort to boost productivity, reduce expenditure and gain competitive advantage.

3 Key Drivers and Considerations for AI Analytics in 2024

For independent software vendors (ISVs), creating unique differentiators and value increasingly entails adopting the latest technologies to enhance your product experience, especially in an ever-evolving competitive landscape with multiple new tech solutions. AI analytics is the latest emerging field in business intelligence (BI) solutions that offers new sophisticated capabilities for the user experience (UX) of your product’s analytics component.

Data Security and Compliance: 5 Essential Considerations

With data continuously growing in complexity and quantity, ensuring data security is more important than ever when choosing to buy a business intelligence (BI) solution. From data protection to data governance, having a BI platform that enables you to control, audit, encrypt and manage user access and usage of sensitive data is essential.

Top 5 Grafana Alternatives for Analytics and Data Visualization

In the competitive analytics and data visualization landscape, Grafana has carved out a niche with its open-source flexibility and powerful data visualization features. However, Grafana faces certain limitations in terms of advanced analytics functionalities and less seamless integration with your software product compared to analytics and data visualization tools sourced from broader business intelligence (BI) ecosystems, such as.

How to Create a Pie Chart in Yellowfin Dashboards

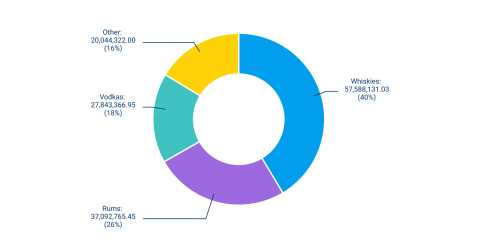
Welcome to the latest entry in Yellowfin Japan’s ‘How to?’ blog series! In our previous blog, we went through how to create big number and vertical column charts in Yellowfin, as well as how to add a 'back-to-top button to your dashboard. We categorized the charts to be displayed on the dashboard by aggregation axis, and created charts that aggregate on the axis of Year.

What is the Augmented Consumer? Understanding Users of AI Analytics

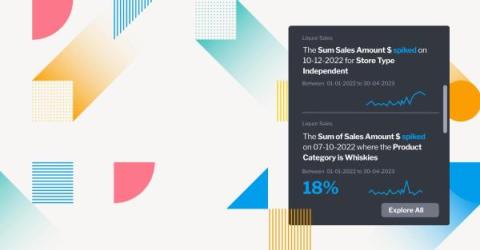
The rise of AI-powered features in today’s analytics solutions has increasingly displaced our reliance on dashboards by making it easier for business people to analyze their data. With this rising paradigm shift, a new label has emerged: The augmented consumer. On a surface-level, the word ‘augmented’ may conjure up a variety of different interpretations. AI-based dashboard assistants? Natural language-led reporting?

How to Add a 'Back to Top' Button to Your Yellowfin Dashboard

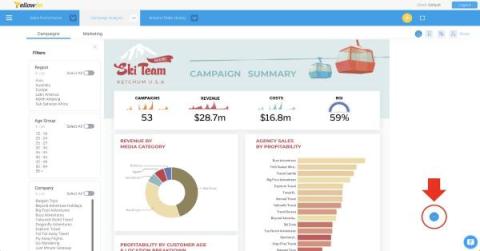
Welcome back to Yellowfin Japan’s ‘How to?’ blog series! In our previous blog, we went through how to create big number and vertical column charts in Yellowfin, and the many different charting options available in Yellowfin Canvas. Before we re-visit our regular series, we want to share a shorter dashboard walkthrough.

How Embedded Analytics Drives Product-Led Growth

Achieving product-led growth (PLG) is a continuous goal for independent software vendors (ISVs) and enterprises aiming to scale efficiently and sustainably. The challenge is differentiating your product enough in a crowded market to retain users, and unlock new revenue streams. Traditional approaches to product-led growth often fall short in meeting the dynamic needs of today's data-driven users, who seek immediate, actionable insights within the applications they use.