Systems | Development | Analytics | API | Testing

Databox

6 Ways Marketers Are Using Generative AI: Is It Really Saving Time?

AI was the hot topic of 2023 and will continue to reign in 2024: ChatGPT first launched at the end of 2022 and became a massive hit in just a few months. Google released Bard shortly after, and then, new AI tools just kept popping up, prompting marketers to learn how to leverage them to become more efficient and productive.

Our methods and challenges of integrating 100+ SaaS APIs

In the era of big data, where information serves as the lifeblood of digital interconnectedness, the ability to seamlessly harness and analyze data is paramount. Data, with its transformative potential, connects the world, enables deep analysis, and underpins critical decision-making processes. At Databox, our mission is to empower businesses to enhance their performance through robust data analytics.

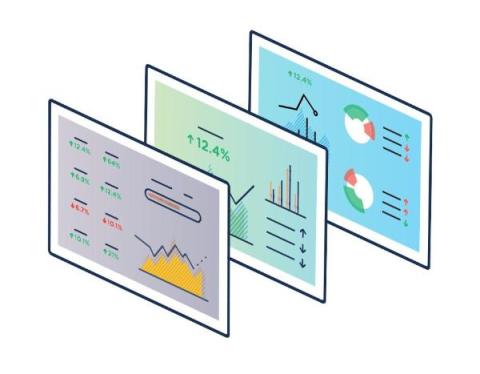
8 Best Reporting Tools in 2024

Are you hitting your monthly revenue goals? Driving a ton of traffic to your website? Have a great closing rate in your sales department? That’s great news – but your C-executives and shareholders won’t exactly take your word for it. Instead, you need a quality reporting tool to share your performance and key insights in a clear and professional manner.

How engagement surveys impact team effectiveness and build a high-performing culture

Growing as a company involves a myriad of elements, but ultimately, it comes down to the practices and routines that teams have. These habits have a great impact on boosting team performance and engagement, which helps the company move ahead together. Fostering a high-performance culture means creating a space where team members do their best because they are engaged, feel valued, and keep learning.

Benchmark Your Metrics in Databox!

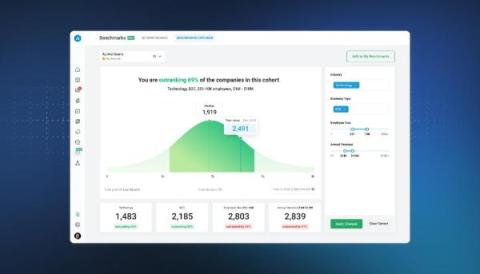
🥁 BIG NEWS: Benchmarks now available in the Databox app! Curious about how your results measure up against companies like yours? Using Benchmarks, you will be able to compare your performance to similar companies, identifying where you are ahead and where you fall behind. Now you can benchmark any metric and empower your data-driven insight right in our Databox Analytics app.

7 Key Product Management Metrics and KPIs to Track in 2024

Here’s a question for you – is your product really what your users need? Does it effectively solve their pain points? Is it simple to use and can they navigate it easily? Does it have all the necessary features? The problem is, most people answer this question based on their assumptions, subjective opinion, or what a handful of power users tell them.

New in Databox: See How You Stack Up To Companies Like Yours With Benchmarks

How do you know if your performance is good? For example, your click-through rate on LinkedIn Ads is 4.2%, is that good? Is your CPC too high? Are your conversions too low? One way to answer these questions is by using Benchmarks. In a nutshell, Benchmarks provide a point of reference – a reliable standard that helps you compare how you’re doing against businesses like yours. You can use them to understand where you’re performing well, and where you have opportunities to improve.

Our architectural approach to support multi-product strategy

Databox is mostly known for its business analytics and visualization capabilities. As a single-product company for the majority of its existence, it was developed in a way that catered to just one product. As the company began its path as a startup, it was convenient to keep the architecture simple and flexible to quickly adapt to change and align direction if needed to ensure business success.