Systems | Development | Analytics | API | Testing
Ably
Choosing the right WebSocket library for React projects
As users now expect applications to provide instant updates, live chats, and dynamic content, modern web development requires the ability to deliver realtime experiences and communication between users and servers. WebSocket is a communication protocol that allows full-duplex two-way communication between a client and a server over a single TCP connection. The connection persists unless it is explicitly told to disconnect or in case of network or server failure.
React Hooks now part of Ably's JavaScript SDK
React is one of the most popular JavaScript libraries in the world, and is known for its performance, scalability, and flexibility. Whether it’s single-page apps, high fidelity frontends, or even in some cases static sites, there's a high chance React is being used to build them. Today, we are pleased to announce that we have now baked in support for React Hooks within our Ably JavaScript SDK.
Creating Collaborative Applications with Ably Spaces
Custom vs. off-the-shelf React web notification systems: Which is better?
When building a React web application, one feature you might be considering is a notification system. Notifications enhance the user experience by providing real time updates, alerts, or calls to action. However, the big question is whether to build a custom notification system from scratch or go for an off-the-shelf solution. This choice isn't simple and can influence your project's overall cost, resource allocation, and success.
How Figma took Sketch's market share with realtime collaboration
The top 11 React chart libraries for data visualization
In today’s data-driven world, presenting data in a visually compelling manner is paramount for user engagement and clarity. React, a premier library for building UIs, has an extensive UI component ecosystem which offers many options for integrating charts. From business analytics dashboards to scientific data displays, the right charting library can transform numbers into insightful narratives.
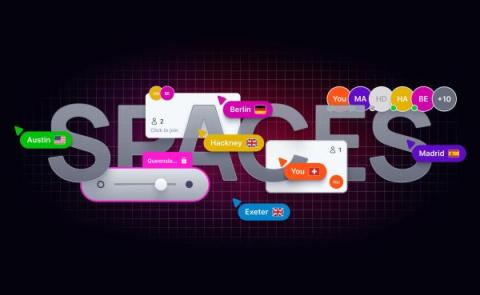
Introducing Spaces: Build collaborative environments in a few lines of code
We are very excited to announce a new product — Spaces! The Spaces SDK comes with an intuitive set of APIs that allow you to build realtime collaboration features such as avatar stacks, live cursors, member location and component locking, in days. Each API is optimized for their specific use-case, reducing integration effort.
5 takeaways from Matthew O'Riordan's chat on the Category Visionaries podcast
Category Visionaries is a podcast where founders and CEOs share their stories from the front line of business. It specializes in discussions with leaders who are disrupting and reimagining the business model of their industry. Our CEO Matthew O’Riordan recently sat down with the podcast’s host, Brett Stapper, to discuss his journey since founding Ably, the reasons he did so, and the decisions he’s made along the way. Here’s the full discussion.
How to use Google Charts with React for Dynamic Data
According to research from Matillon and IDG, data volumes increase by 63 percent per month on average in an organization. Examining such substantial volumes of data without the right tools makes it impossible to make informed decisions, even in small businesses. The key to deriving useful and profit-driving insights from data is data visualization - which turns complex raw figures into meaningful visual representations of the data. Google Charts is a free data visualization library provided by Google.


