Systems | Development | Analytics | API | Testing
November 2021
Qlik Cloud and Amazon SageMaker: Expanding the Power of Predictive Analytics in the Cloud Together
The ability to discover insights from past events, transactions and interactions is how many customers currently utilize Qlik. Qlik’s unique approach to Business Intelligence (BI) using a unique analytics engine and intuitive interface has democratized BI for typical business users, who usually have little to no technical savvy.
Qlik Cloud Enables Buyk To Rapidly Spin Up Online Grocery Shopping Operations in New York City
The phenomenon of web-based, at-your-door-in-minutes, restaurant food-delivery service is widespread and commonplace nowadays, with various apps and platforms, such as Grubhub or DoorDash, providing diners with an at-home eating experience – look up a restaurant, choose what you want to eat, and your food is on its way. The same can be said about grocery shopping.
Combo Chart
In some of my earlier blog posts, I’ve gone through some more novel visualizations, such as the Sankey chart and distribution plot. But, for this post, it’s time to go back to the more common Combo chart, also sometimes referred to as a dual axis chart.
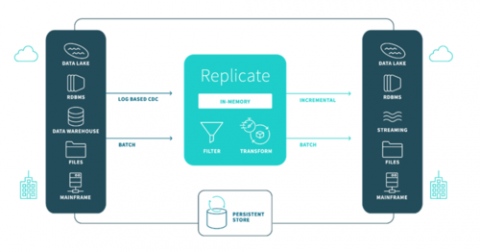
The Architectural Principles of Qlik Replicate: Scalability & Flexibility
A look at Qlik Replicate's zero-footprint architecture and how it is designed for scalability and flexibility.
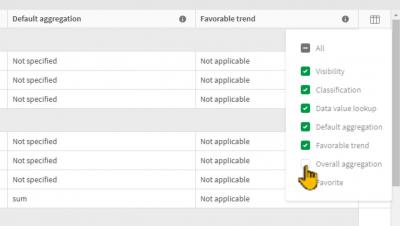
Qlik Sense SaaS in 60 - Business Logic Enhancements
Next Generation Analytics Consumption Is NOT About "Killing Dashboards"
As we get closer to the end of 2021, looking back the data and analytics technologies have evolved significantly over the last few years. We have seen the introduction of augmented analytics capabilities embracing user self-service and multimodal delivery of analytics insights. In addition, we have seen new data integration and catalog capabilities in response to the demands of new regulations and governance needs.
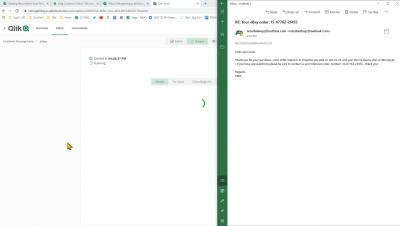
Simple Bulk Email Customer Messages with Qlik App Automation - Part 2
The Evolution of Data, Analytics, and AI-All in Less Than an Hour!
Much of my focus over the last couple of decades has been in analytics, big data, and AI, and Joe DosSantos and I discussed the progression of these fields over time in a recent Data Brilliant podcast episode. My subtitle for that episode might be, “The Promise and Perils of a Hot New Field,” as we addressed several aspects of how these popular concepts have evolved in the first fifth of the 21st century.
Why Data Quality and Analytics Should Always Go Hand In Hand
Part of our vision at Qlik is to simplify analysis for everyone – meaning that Qlik Sense is not just a tool for IT and the data analyst but something that can be put in the hands of everyone.
Introducing Trends 2022: "Interwoven" Marks the End of Competition As We Know It
What’s struck me in the past years is how the tools we have at our disposal, at a societal and corporate level, are insufficient to solve the big challenges we face. We see this with the pandemic, climate change, social inequity and much more. And, more recently, in the disruptions in supply chains, which have created global shortages of key components and materials. To solve our biggest issues, we don’t have a choice but to get together and create joint, interwoven solutions.
Sending a Personalized Email to Customers using Qlik App Automation and Qlik Sense - Happy Together!
Five Essential Elements of Data Governance
What is data governance? Well, for one, it is a buzzword. And, with buzzwords, we often forget to slow down and investigate what they actually entail. This article is dedicated to exploring five essential elements of data governance – emphasizing the importance of implementing it from end to end.


