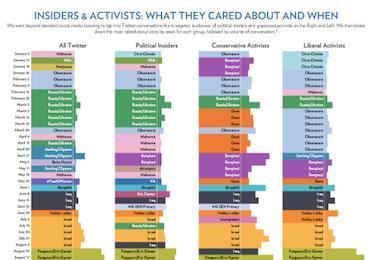
The Best Data Visualization Examples
Data visualization is the art of representing complex data sets in a visually appealing way. It can help your reader better understand what they're looking at, and it's an ideal way to make sense of large or confusing sets of data. For example, imagine reading a report about a study that involved tracking participants' sleep patterns for three months.


