
Systems | Development | Analytics | API | Testing

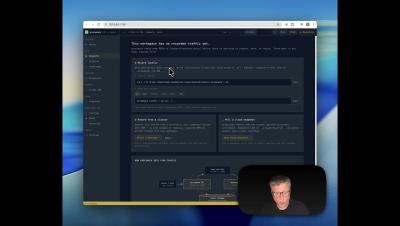
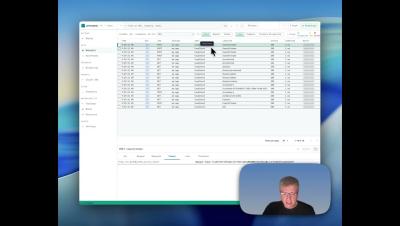
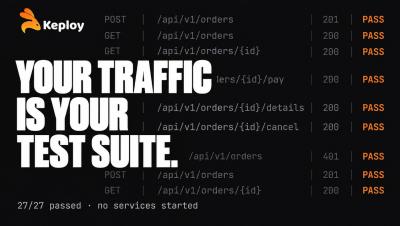
Turn Real API Traffic Into Tests on Kubernetes | Keploy Demo

Test your whole backend without starting any of it. In this demo, Keploy records real API traffic from an order service running on Kubernetes and turns it into API tests and dependency mocks automatically: MySQL, HTTP and DNS calls included. Then it replays those tests against a digital twin of the backend, so nothing else needs to be running.
What You Need to Know About Kubernetes vs. Docker Compose

Choosing between Docker Compose and Kubernetes can feel overwhelming, especially when both play an important role in modern containerization strategies. In this video, Zend Professional Services Manager Adam Culp breaks down Kubernetes vs Docker Compose. You’ll learn the essentials of container orchestration, discover when simplicity is an advantage, and understand when it's time to scale—plus, he recommends a new tool that can help, whether you choose Kubernetes or Docker Compose.

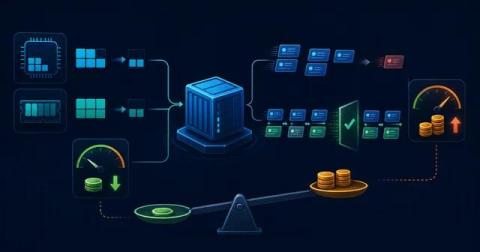
The Pod Was Cheaper. The Service Wasn't.

A smaller Kubernetes pod can lower allocation cost while completing less work. Green status codes and matching schemas can hide it. This walkthrough combines OpenCost allocation data with proxymock behavior and performance evidence. A candidate passes only when behavior and throughput hold while unit cost falls.

Managing Across Schedulers: HPC Meets Kubernetes

Almost every infrastructure team running modern AI is wrestling with the same question. The orchestrator their AI workloads want, Kubernetes, and the orchestrator their HPC environment was built on, Slurm, pull in different directions. This piece, drawn from the HPCKP 2026 session of the same name, looks at why that tension exists, what the workloads actually look like, how teams are bridging the two today, and where the pattern is heading.

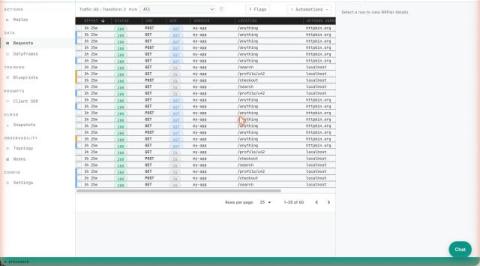
Instant Kubernetes Observability with Proxymock #speedscale #kubernetes #ebpf #devops #cloudnative

Learn how to get instant observability into your Kubernetes cluster by installing the Speedscale operator and proxymock tool. In this step-by-step tutorial, we walk you through setting up the operator to capture live network traffic (including encrypted traffic, API calls, and database calls) without complex instrumentation or manual configuration.
Sponsored Post

The Kubeshark Workflow That Doesn't Stop at the Dashboard

The Observability Gap shows up the moment you try to reproduce a production bug locally. Your traces tell you a request was slow. Your logs tell you which line printed. Neither tells you what was actually on the wire: the headers, the JSON body, the surprise field your client started sending last Tuesday. Until now, closing that gap meant SSHing to a node, attaching a debugger, or shipping a sidecar through change review.