We collect the latest Development, Anaytics, API & Testing news from around the globe and deliver it direct to your inbox. One email per week, no spam.
Join Ehrar Jameel, Head of Data and Analytics, as he demystifies the concept of data strategy in this enlightening snippet from our Art of Data Leadership series. In this segment, Ehrar delves into the fundamental question: What is a data strategy? Ready to delve deeper into the world of data leadership? Click here for the full Art of Data Leadership playlist and gain invaluable insights from Ehrar and other industry experts.
Executives across various industries are under pressure to reach insights and make decisions quickly. This is driving the importance of streaming data and analytics, which play a crucial role in making better-informed decisions that likely lead to faster, better outcomes.
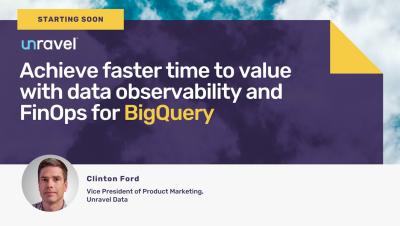
Right now, 88% of companies surveyed are failing to achieve optimal price/performance for their analytics workloads. Why? They don’t have the staff, their skilled engineers spend too much time doing toilsome work, and optimizing data workloads for performance and efficiency. With this in mind, Unravel is hosting a virtual event to help you leverage Unravel to achieve productivity, performance, and cost efficiency with BigQuery.
Initiative involves development of AI frameworks to expedite time to market and reduce the complexity of building and deploying infrastructure for generative AI.
Explore the many ways to locate, access and consume content within the Continuous Classroom to better enable you to find what you are looking for and help you become more familiar with our learning platform.
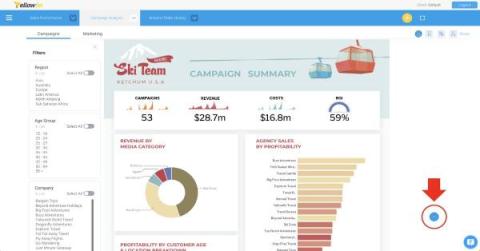
Welcome back to Yellowfin Japan’s ‘How to?’ blog series! In our previous blog, we went through how to create big number and vertical column charts in Yellowfin, and the many different charting options available in Yellowfin Canvas. Before we re-visit our regular series, we want to share a shorter dashboard walkthrough.