
Systems | Development | Analytics | API | Testing

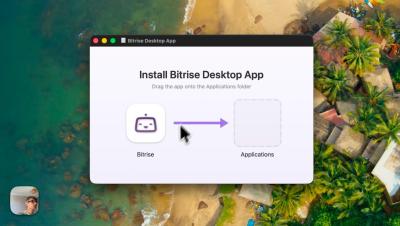
Walkthrough: Bitrise Desktop App

Senior Product Manager Kaushal Vyas walks through the Bitrise desktop app, showing you how to rescue your focus from endless browser tabs. Inside: how to pin your mobile CI/CD pipelines right to your macOS menu bar, set up targeted build filters, customize failure notifications, trigger new builds, and utilize convenient shortcuts to access specific commits, pull requests, and logs.


Build Vs Buy AI Solutions: The Most Dilemmatic Situation of Today's AI Era

‍ ‍Satya Nadella said it plainly: "AI is not a feature. It is the platform shift of our generation." And he is right. Whether you are a $50 million mid-market firm or a $5 billion enterprise, the mandate from the board is the same: automate, optimise, and scale with AI. But here is the uncomfortable truth that most AI vendors will not tell you. Technology is seldom the bottleneck.

Your step-by-step guide to Engineering interviews at Bitrise

If you are thinking about applying for an Engineering role at Bitrise (which we highly encourage), you probably want to know what happens after you hit that "apply" button. This post walks you through every step. It helps you decide whether we're the right place for you, gives you clarity before the interviews, and sets you up for success even before you apply.

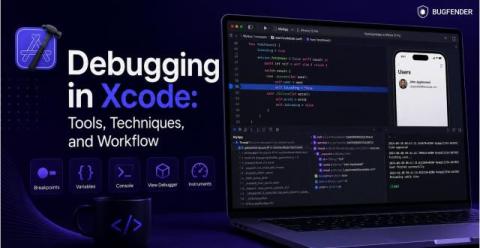
Debugging in Xcode: Tools, Techniques, and Workflow

Xcode debugging tools integrate smoothly with the rest of the Xcode ecosystem and offer myriad benefits to developers, including powerful breakpoints and source-level visibility. This guide will help you unlock them. We’ll equip you with the knowledge to: If you’ve come for a specific piece of knowledge, here’s the full list of contents so you can go straight there.

Data Mage: meet our AI data analyst that lives in Slack

As many other data teams do, we have a dedicated Slack channel (#data) where the whole company can ask data-related questions that get picked up by a designated, weekly-rotated data analyst (data mage). It can become tiresome quickly as the questions are fairly repetitive and it takes away precious time from other high-impact tasks. The team built clean, well-documented marts and reports in Metabase that are used regularly, but these were still missing something that makes reporting truly self-service.

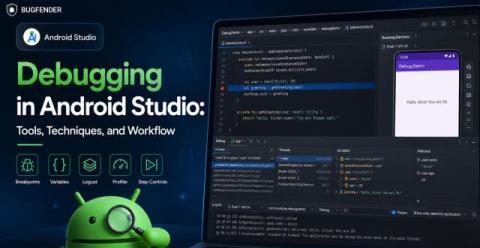
Debugging in Android Studio: Tools, Techniques, and Workflow

Debugging Android apps can feel daunting given the sheer size of the ecosystem. However the suite of Android Studio debugging tools allows us to find, fix and prevent problems across our entire user base. Wherever they are, whichever devices they’re using. This guide will give you a practical workflow to maximize the functionality of Android Studio, and empower you to debug Android apps from first breakpoint to production issues.

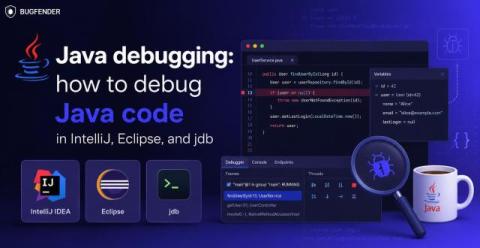
Java debugging: how to debug Java code in IntelliJ, Eclipse, and jdb

An effective Java debugging strategy lets us pause execution, inspect data, and observe real execution rather than relying on vague assumptions. The complexity of the Java Virtual Machine creates unique challenges, but a focused approach will turn this complexity to our advantage. This guide will equip you with the tools to do this, looking at: By the end, you’ll have a practical workflow to debug Java reliably across local and remote environments.

Bitrise Remote Development Environments demo

In this short demo, our Senior Solutions Engineer Naveen Nazimudeen introduces Bitrise Remote Developer Environments (RDEs) and shows how they speed up mobile development. If you'd like to learn more, get in touch with us! Bitrise provides a full-stack, vertically integrated mobile DevOps solution that unites the tools, processes and testing frameworks engineering teams need to build best-in-class mobile experiences. Over 400,000 developers use Bitrise’s products: Bitrise CI, Build Cache, Release Management, and Insights.

How we built a coding agent that lives in Slack, and the recipe to build your own

One of the busiest engineers at Bitrise doesn't have a laptop. It lives in Slack. Assign it a Jira ticket or @mention it in a thread, and it reads the requirements, posts a plan, spins up a cloud dev machine, writes and tests the code, opens a pull request, watches CI, reacts to review comments as they land and once the pull request merges, cleans up after itself and closes the ticket.

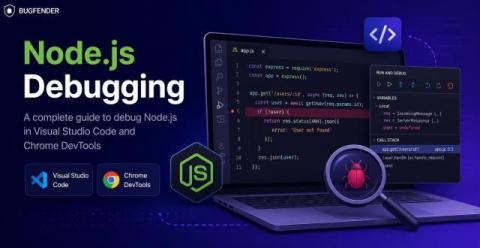
Node.js Debugging in VS Code and Chrome DevTools

Node.js debugging allows us to identify and fix errors, unexpected behavior, and performance issues in server-side JavaScript applications. Instead of using the less precise console.log, we can connect a real debugger and control execution step by step. Most Node.js developers actually use one of two distinct setups: This guide will show you how to use both technologies, with a clear step-by-step workflow for each.