What is a KPI?
A Key Performance Indicator (KPI) is a metric that signals how well a company is achieving important business objectives. Here’s how to set and track yours.


A Key Performance Indicator (KPI) is a metric that signals how well a company is achieving important business objectives. Here’s how to set and track yours.
We’re delighted that Yellowfin has been awarded a place on the public sector’s G-Cloud 10 (G10) framework, which enables us to supply British public sector organisations with the Yellowfin platform more easily.
In this month’s installment of What’s Happening in BigQuery, we’re sharing new features intended to make your life easier: some make BigQuery more performant and more cost effective, while others, like BigQuery ML, enable groundbreaking analysis tools in a cloud data warehouse that’s a first of its kind. First off, we just finished Next ‘18, our annual event focused on all things cloud.
Our financial year came to a close at the end June and Yellowfin had another solid year of growth. There was consistent growth across all regions – in Europe, Japan, APAC and the US.
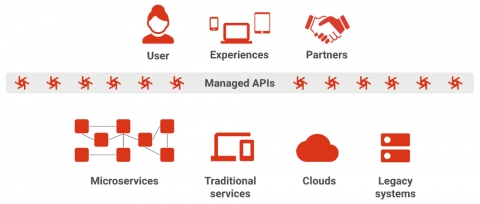
Are they basically just an evolved version of service-oriented architectures (SOA)? Since a microservice must be exposed via an application programming interface (API) for an organization to scale it to new developers, does that mean managing microservices is basically the same as managing APIs? As this article will discuss, the answer to both of these questions is a clear “no” — and companies looking to get the most from their microservices need to understand why.
There is a common misconception about data-informed decision making. It goes that once we implement the right tools, and figure out how to analyze the data correctly, the data will automatically turn into insights and will translate to better business decisions. It sounds great in theory.
All marketers have to deal with essentially the same problem when managing their online campaigns and looking for the right attribution model: the data they need for evaluation is scattered across various systems, and collecting and collating it takes too much time. If they decide to use solutions intended to help them to handle this problem, they often find such solutions are not, in themselves, enough.
When I speak to people who are thinking about implementing BI, they are often overwhelmed by all the things they could measure. Many start by wanting to measure everything, which doesn’t necessarily help them. That’s because there’s an inherent cost in measuring things – everything you report and track creates an ongoing burden that your organization has to maintain. That’s why it’s important to be selective about what you measure from the get-go.
Predict and measure the ROI of your next website redesign by following this 11-step playbook, compiled from dozens of experts.
Makeover Monday is a global initiative started by Tableau to encourage people to build visualizations. It involves releasing a new dataset each week and letting people reimagine the way it is visualized. It’s a really interesting experience and anyone can participate.