Systems | Development | Analytics | API | Testing
Observability
Introducing Dynamic Observability: A no-code integration between Elastic and Rookout
In recent years, Observability has become a de-facto standard when discussing development and maintenance of cloud-native applications. The need to develop an observable system and ensure that as it runs in production, engineers will be able to detect performance issues, downtimes, and service disruptions, has evolved into a rich ecosystem of tools and practices.
Application Observability With Kuma Service Mesh
Rookout Named A Gartner Cool Vendor in Monitoring and Observability
We are honored to announce that Rookout, the world’s leading dynamic observability and debugging platform, has been recognized by Gartner as a Cool Vendor, based on the October 11 2021 report titled “Cool Vendors in Monitoring and Observability – Modernize Legacy, Prepare for Tomorrow” by Padraig Byrne.
Services Don't Have to Be Eight-9s Reliable with Liz Fong Jones from Honeycomb | Kongcast Episode 1
Kong Konnect: Maximize Service Reuse, Observability and Manageability
Service Mesh and Microservices: Improving Network Management and Observability
Whether you're transitioning away from a monolith or building a green-field app, opting for a microservice architecture brings many benefits as well as certain challenges. These challenges include namely managing the network and maintaining observability in the microservice architecture. Enter the service mesh, a valuable component of modern cloud-native applications that handles inter-service communication and offers a solution to network management and microservice architecture visibility.
How to Automate Service Mesh Observability With Kuma
The more services you have running across different clouds and Kubernetes clusters, the harder it is to ensure that you have a central place to collect service mesh observability metrics. That’s one of the reasons we created Kuma, an open source control plane for service mesh. In this tutorial, I’ll show you how to set up and leverage the Traffic Metrics and Traffic Trace policies that Kuma provides out of the box. If you haven’t already, install Kuma and connect a service.
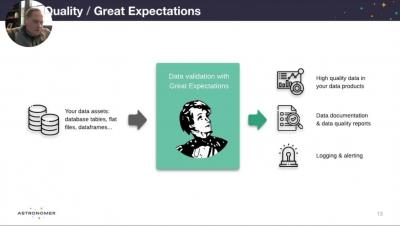
How to Use Data Observability as a Strategic Advantage
Optoro’s platform finds returned items a new home. Here’s how its data engineering team keeps mission-critical data flowing.


