Systems | Development | Analytics | API | Testing

Reporting

Tabular Reporting for NPrinting Users - Do More with Qlik

Join Michael Tarallo, along with special guests Product Manager Andrew Kruger and Principal Platform Architect Johnny Poole, for part 2 of Qlik Tabular Reporting. In this session, the focus shifts to the migration path for NPrinting users, exploring available utilities, migration paths and best practices for a seamless transition.

16 Top Hospital KPIs for 2024 Reporting

A hospital key performance indicator (KPI) is a quantifiable measure that monitors the quality of healthcare provided by the hospital and measures the overall success of the business. Like many other service providers, hospitals depend on their customers (patients) to run their business. However, in order to thrive, they must also operate sustainably and mange costs. A successful hospital runs efficiently, provides life saving services and plays a valuable role in driving public health measures.

15 Best Non-Profit KPIs and Metric Examples for 2024 Reporting

What is a kpi? A non-profit key performance indicator (KPI) is a numerical measurement that gauges the ability of a non-profit organization in accomplishing its mission. Non-profit metrics quantify the organization’s many endeavors in extending its impact on society. The spirit of KPIs generated for a non-profit organization is not unlike a for-profit business.

What Is Data Reporting and How to Create Data Reports for Your Business

According to Gartner’s prediction, 90% of organizations will consider information the most valuable asset a business may have. And where does this information come from? Here’s a magic word – data. Even though many companies report making important decisions based on their gut feeling, 85% of them would like to improve the ways they use data insights to make business decisions.

What Is KPI Reporting? KPI Report Examples, Tips, and Best Practices

We’re constantly bombarded by data points and it takes real effort to make sense of them. While having a lot of information is a good thing, it’s easy to get overwhelmed and miss what’s really important. Businesses especially need to be able to sort the wheat from the chaff and assess their data accurately. But, how do you go about this exactly?

#shorts - Tabular Reporting PDF Output Just Added #data #visualization #qlik #qliksense

Create dynamic tabular reports by combining the Qlik add-in for Microsoft Excel with report preparation features available within a Qlik Sense app. Deliver report output by email and to folders defined in Microsoft SharePoint connections. Reports can be in.xlsx or PDF format.

8 Best Reporting Tools in 2024

Are you hitting your monthly revenue goals? Driving a ton of traffic to your website? Have a great closing rate in your sales department? That’s great news – but your C-executives and shareholders won’t exactly take your word for it. Instead, you need a quality reporting tool to share your performance and key insights in a clear and professional manner.

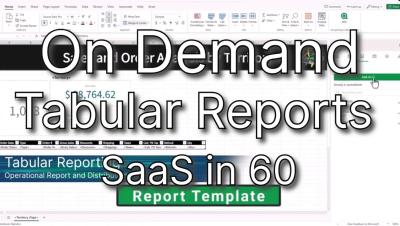
SaaS in 60 - Tabular Reporting

This week Qlik Cloud customers can now address common operational report and distribution requirements with our new Tabular Reporting capabilities. Report developers can use an O365 Excel add-in to create custom, formatted, Excel documents from Qlik data and Qlik visualizations. Governed Report Tasks can burst these reports, delivering recipient specific data to any stakeholder, with the Qlik platform as the source for business decisions.

The 7 Best Reporting Tools for 2024

Reporting tools solve a key problem for businesses by enabling them to communicate data in a way that is accessible, easy-to-understand, and useful for both frontline staff and management teams. These tools take raw data and turn it into tables, charts, and graphs ready for consumption, turning complicated data into visuals that better enable users to spot patterns and trends.