Analytics
Data privacy hidden gems in Talend Component Palette: Part 2
Data Privacy is becoming the main buzz word in technical circles day by day. Sometime back, we thought that illegal gathering personal identifiable information from data servers can happen only in James Bond and Mission Impossible movies. But technology is changing quite rapidly and in this era of global virtual connectivity, customer private information is becoming more and more insecure. The news of customer data getting misused by data analytics companies, data theft from major banks, etc.
The Top 10 Anomalies of the Last Decade
As a company known for our anomaly detection, we know a thing or two about spotting irregularities. So as we reached the end of 2019, we couldn’t help but think back on the 2010s and the anomalies that shook the world. Once we got to listing them, it really became tough to pick just 10. Ultimately, after much debate, we ranked them based on their impact, newsworthiness and how utterly unexpected they were.
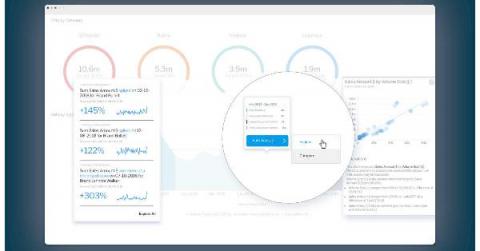
Finally, a BI dashboard built for the business user's end game
Business users haven’t adopted the dashboard wholeheartedly. Some of that is history, some of that is data illiteracy, and some of that is the fault of dashboard platforms themselves - how and who they’re designed for.
Why SaaS vendors should invest in automated analytics
One of the challenges with being a fast-growing SaaS vendor is that you're so consumed with running your business that you're unlikely to stop and take a breath. If you’re growing quickly, there can also be a perception that you don’t really need to look at what’s happening in your business. Instead, you may divert resources to building a new product or marketing rather than actually thinking about your business.
Application Performance Management for Big Data
How to optimize your big data workloads running in the cloud
Countdown to CCPA compliance: Top 10 data governance tips
In just a couple of days, the new year will be upon us and the California Customer Privacy Act (CCPA) will be in full effect. This means, going forward, businesses that collect personal data from people who reside in the Golden State must now honor their requests to access, delete, and opt out of sharing or selling their information.
16 Ways To Measure Social Media Engagement Using Only Google Analytics
3 reasons your data presentations need governed data (and how that makes you look smart)
Presentations. Slide decks. Do these words elicit yawns? Even if they do, we all know that presentations are central in the business world for keeping people up to date and informed of organizational progress and changes. One of the frequently used presentation formats is the end of month/quarterly update that is full of numbers and charts. But putting data in your presentations presents some issues.


