

Systems | Development | Analytics | API | Testing

How to Integrate BI and Data Visualization Tools with a Data Lake

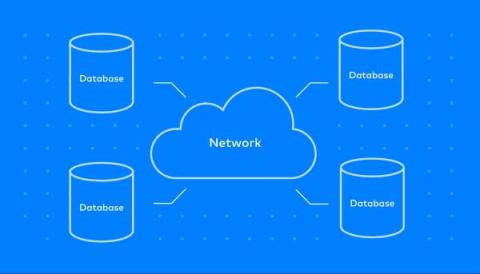
For the past 30 years, the primary data source for business intelligence (BI) and data visualization tools has generally been either a data warehouse or a data mart. But as enterprises today struggle to cope with the growing complexity, scale, and speed of data, it’s becoming clear that the data tools of 30 years ago weren’t designed to handle the enterprise data management challenges of today - especially with the growing variety and amounts of data that enterprises are generating.

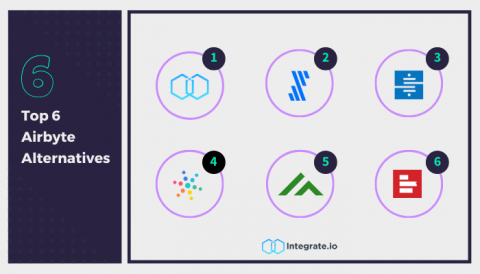
Top 6 Airbyte Alternatives

The data-driven culture cultivated in modern-day organizations is focused on deriving the best possible business insights from their data. With data scattered across the globe, these organizations' most significant challenge is to break the silos of their decentralized data and gather new data for analysis in real-time. To address the data silo problem, data engineering brought forward solutions like ETL, ELT, and data integration tools.

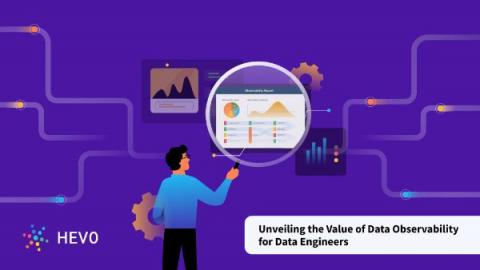
The Data Engineer's Crystal Ball: How Data Observability Helps You See What's Coming

Imagine you’re driving a car. You can see what’s happening on the road in front of you, but you have no idea what’s going on under the hood. It’s like driving blindly without any gauges or a dashboard to give you vital information. You don’t know how fast you’re going, how much fuel you have left, or if something is about to go wrong. In the same way, data engineers who lack data observability are like drivers with a limited view of the road.