What's New in ReadyAPI 2.4?
Learn about the newest features in the ReadyAPI 2.4 update, including a one-click Jenkins integration for SoapUI Pro.


Use this guide to learn about all the different considerations and elements when it’s time to optimize your website for mobile devices.
Memory profiling in PHP has traditionally been hard. Most memory profilers compare the memory or peak memory before and after a function call to find out how much memory usage increased or decreased. This can be achieved by calling the equivalent of memory_get_usage() and memory_get_peak_usage() functions from within the profiling extension.
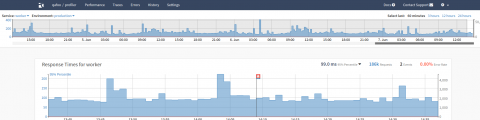
We have just rolled out an improvement to the Time Explorer, the low precision (15 minutes) chart that is rendered in the Dashboard and Application view with performance data for the complete retention period of your plan. It is now shown directly below the the head navigation now and stays there when navigating through to snapshots or transaction details screen. Additionally it now includes the service and environment switchers that have been part of the main application graph before.
New and Existing Applications Extend Five Year Partnership; Innovations Showcased at UN’s STI Forum 2018
They’ve grown to 75 employees in 50+ cities, have been profitable since year 2, and have raised $12 million as a tool to further their mission–here’s the story of everything in between.
A View from the Big Data & Analytics Retail Summit.
Have you ever thought about what the best charts are for visualizing distributions?