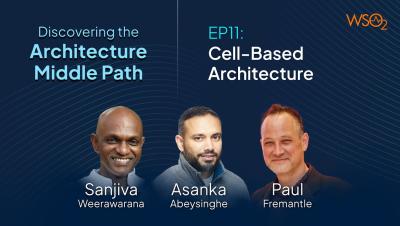
Systems | Development | Analytics | API | Testing

S1.E9: Best practices for accessibility testing | QA Therapy Podcast

Are you battling against common accessibility myths, such as that it is too costly, time-consuming, or requires specialized training? These are all signs that accessibility isn't receiving the attention it deserves to ensure inclusivity for everyone. Today, we're fortunate to have Ady Stokes to provide solutions to address these accessibility challenges.

Fivetran Demo: Securely move your data to Databricks with Fivetran's new Hybrid deployment option

Securely move all of your data from one platform with Fivetran's new Hybrid deployment option. Move security-restricted data with pipelines hosted in your own environment, controlled by Fivetran's easy-to-use control plane.

Kafka Live Stream #26 | Rapid development for real-time analytics with @Implydata

How can engineers enable real-time insights when working with high-throughput, data-intensive streams? In this 30-minute session, Imply and Lenses.io show you how to Enable self-service access for developers working with critical, high-velocity data flows in #apache #kafka Ingest and normalize complex data structures, enabling real-time analytics at scale via modern databases like #druid.

What's New in ThoughtSpot - 9.12.5 Cloud Release

ThoughtSpot Analytics Cloud 9.12.5 is now available! Ask questions about your business in natural language using the ThoughtSpot mobile app. Design visual data stories with customized font, background, header styling, and auto-fitting images. Forecast future trends with single-click time series forecasting in SpotIQ.

Explore CLI - Insomnia Collection Imports and Standalone Binaries

In this episode, Frank Kilcommins and Yousaf Nabi, walk us through the new `import-insomnia-collection` command of the Explore.CLI. Now you can easily import collections from Insomnia directly into SwaggerHub Explore. Additionally, Explore.CLI now comes with standalone binary options meaning you do not need to have.NET installed.

Present & Share Performance With Your Company and Clients | Databox 101 | Chapter 3.5

While dashboards let you see real-time performance to answer “How am I doing right now?”, Reports take it a step further. With Reports, you can provide a more comprehensive view of your historical performance - with all the context - to your teams, clients, or stakeholders. In this video, you’ll learn: Bookmark this tab AND share the series with your entire company/team! Databox empowers everyone - leaders, managers, and individual contributors alike.