Systems | Development | Analytics | API | Testing

Analytics

Visualize BigQuery data with Looker

Learn how to transform your raw BigQuery data into captivating visualizations and actionable insights. This video demonstrates how to seamlessly connect and visualize your BigQuery data using Looker’s user-friendly interface and powerful semantic modeling capabilities. Watch along and discover how Looker and BigQuery empower business users with self-service analytics today.

Hitachi Vantara VSP One SDS Enhances Data Protection with Async Replication and Multi-AZ Support

Businesses face an ever-growing challenge: how to protect and manage their most valuable asset – their data. As organizations scale and digital transformation accelerates, the volume generated daily is staggering. IDC predicts that the global datasphere will grow to 175 zettabytes by 2025, requiring a substantial increase in storage capacity across the industry.

Product Highlights: Explore the Latest Features and Updates of 2024

Over the past year, we’ve been dedicated to making Databox faster and more powerful for you and your team. We’ve introduced new features, visualizations, and integrations to help you leverage your data to make better decisions. In case you missed any of these updates, we’ve put together a roundup of the top highlights from 2024.

The Simple Guide to Create a ClickUp Dashboard

In today’s fast-paced, data-driven business landscape, having a comprehensive view of your operations is essential for success. Dashboards provide a centralized, real-time visual representation of key metrics, tasks, and performance indicators, enabling teams to stay organized and make informed decisions. ClickUp’s customizable dashboards elevate this by allowing users to build and personalize their own layouts tailored to specific needs.

From Data Pipeline Automation to Adaptive Data Pipelines

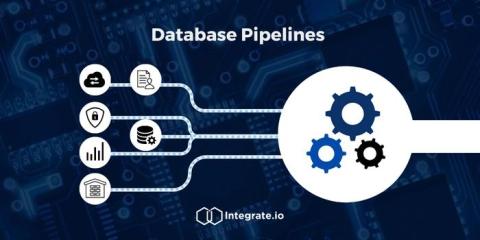
Data pipeline automation plays a central role in integrating and delivering data across systems. The architecture is excellent at handling repetitive, structured tasks, such as extracting, transforming, and loading data in a steady, predictable environment, because the pipelines are built around fixed rules and predefined processes. So, they will continue to work if you maintain the status quo, i.e., as long as your data follows a consistent structure.

Evaluating top data transformation tools for common transformations

Data transformation is a critical step in the data pipeline process, enabling organizations to prepare and process their data for creating dashboards, reporting, and analytics. The right tools can make this process efficient, secure, and scalable. In this blog, we will explore how data transformation tools handle the most common tasks, such as filtering, aggregating, joining, and cleansing data to move to a data lake or a cloud platform of your choice, and what to consider when evaluating these tools.

Unlocking the Power of Data Activation Through ETL

In today's data-driven landscape, the ability to gather, process, and analyze data has become essential for businesses of all sizes. While extracting, transforming, and loading (ETL) data into a centralized warehouse like Snowflake has long been a standard practice, the concept of data activation is gaining traction as the next step in deriving value from data. But what exactly is data activation, and how does it relate to ETL?

Unleashing the Power of Snowflake Analytics: A Comprehensive Guide

In today's data-driven world, businesses are constantly seeking ways to derive insights from their analytics data to make informed decisions. Snowflake, a cloud-based data platform, has emerged as one of the leading solutions for businesses looking to handle analytics at scale. Built for the cloud from the ground up, Snowflake is known for its flexibility, scalability, and unique architecture, which makes it a go-to choice for modern data analytics.