Systems | Development | Analytics | API | Testing

Monitoring

Monitoring Appian with Appian: Tackling Security Alert Fatigue with Low-Code and SOAR

Here at Appian, we have experienced tremendous growth in the past few years by helping our customers solve their most important business problems faster. We do this by providing a low-code platform that brings together humans, systems, and most recently, robots in support of any mission.

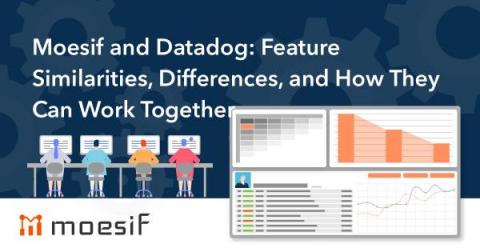
Creating the Ultimate Analytics Stack with Moesif and Datadog

When looking at API analytics and monitoring platforms, many seem to be so similar that it’s hard to figure out the differences between them. We often hear this confusion from users and prospects. In a world with so many tools available, how do we figure out which ones are necessary and which are redundant? One of the most common questions we are asked revolves around how Moesif compares to Datadog and how they could work together.

Metrics and Logs Are Out, Distributed Tracing Is In

In this episode of Kongcast, I spoke with Chinmay Gaikwad, the tech evangelist at Epsagon, about distributed tracing and observability for microservices architectures. Check out the transcript and video from our conversation below, and be sure to subscribe to get email alerts for the latest new episodes.

Metrics and Logs Are Out, Distributed Tracing Is In With Chinmay Gaikwad | Kongcast Episode 5

In this Kongcast Episode, Chinmay Gaikwad, tech evangelist at Epsagon, explains why metrics and logs aren’t sufficient for companies with a microservices architecture. Instead, Chinmay recommends leveraging distributed tracing for optimal observability.

Combine k6 OSS and Prometheus for better observability

k6 Cloud, our managed testing solution, supports Prometheus to store and correlate performance testing metrics within your observability stack since a while now. Announced at Grafana ObservabilityCON, we launched Prometheus support to k6 Open Source - our free, open, and extensible load testing tool. k6 OSS supports sending k6 metrics to multiple outputs such as InfluxDB, New Relic, StatsD, and more.

Adding a Real-Time Layer to Datadog Observability

We all know Datadog. It’s a powerful and established tool that developers, DevOps, and SREs use for anything ranging from monitoring their application’s performance and searching their logs to having an end-to-end understanding of the environment. The nature of cloud-native applications makes the three pillars of observability – (Metrics, Logs, Traces) – needed more than ever to get visibility into your application.

Monitoring Azure API Management with Moesif

API gateways and management platforms like Azure API Management (APIM) are an excellent way to keep your APIs in order. They provide features that every API needs, like API keys, quotas, and caching in a standardized fashion. Your APIs will then behave more homogeneously and can be managed in a central place. They’re also the entry point to your cloud infrastructure and can help you abstract implementation from the interface.

Sponsored Post

Application Logging in 2021

Have you ever written a Hello, World! application? In most of these tutorials the first step is to log words to the console. It's an easy way to understand what is going on with your application and readily available in every programming language. The console output is incredibly powerful, and it has become easier than ever to capture that output as logs. As your application grows and evolves you need to implement a structured application log approach.