How to Trace Microservices WITHOUT OpenTelemetry
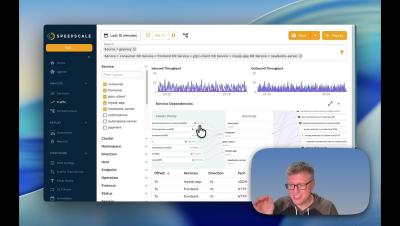
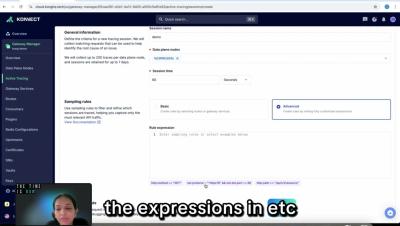
Learn how to trace complex multi-hop transactions across microservices when OpenTelemetry isn't available or trace parents get lost. This quick tutorial demonstrates how to use full-text search in proxymock (a free CLI and UI tool) to isolate user journeys (like looking up a specific username) and instantly generate waterfall tracing views. Whether you are working locally or in a Kubernetes cluster, you can record API traffic, visualize multi-hop requests, and easily transition those captures into load or regression tests.