18 Key Performance Indicators to Include in a Healthcare KPI Dashboard
What metrics should you include in your healthcare KPI dashboard? According to 8 healthcare businesses/agencies, here are the 18 most important ones.


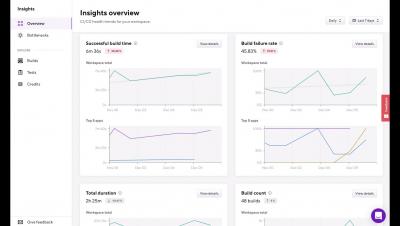
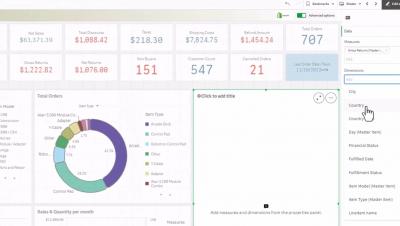
Introducing Dashboards — a great new way to quickly and easily view your most important metrics in one convenient place.
The secret to customer success is making your customers happy and supporting them to succeed. A simple concept – until you try to implement it. You’ll need a great product and a great customer service team, for starters. You’ll also need an in-depth understanding of the customer experience, including their pain points and how you can help solve them. This is where things get trickier, but the answer could already be tucked away in your data.