SmartBear Answers Developers' Call for All-in-one Web Browser and Mobile App Testing
Web and mobile app development converges; teams can reduce context switching and increase confidence in product quality with the harmonized product, BitBar.


In this article, you will learn how Bitrise helps finance apps deliver a better customer experience resulting in more engaged and active users, and more market share.
Part 2 of the WWDC 2022 recap summarizes the key takeaways and learnings from Apple’s 2022 Worldwide Developers Conference.
If you yearn to write more declarative syntax like SwiftUI and level up your data visualization game, Swift Charts is made for you! Apple introduced a new framework that helps you easily work with charts and create gorgeous visualizations. The chart can be anything — from a line or bar chart to something advanced like a range plot, stream graph, heat map, or even a vector field plot.
Right before WWDC 2022, Bitrise announced the first scalable virtualized Apple Silicon M1 CI/CD dev environment. Then Apple announced M2 for iOS, and everyone wonders, is M2 in the cloud happening?
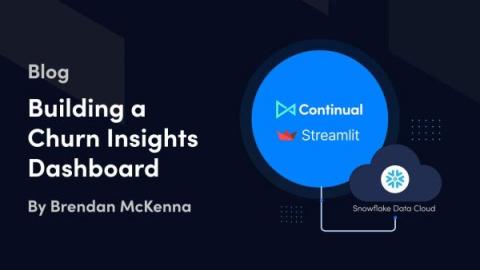
In this tutorial, we’re going to build an interactive customer Churn Insights Dashboard using the open-source Python framework, Streamlit, and the Continual predictions generated in Part 1: Snowflake and Continual Quickstart Guide. In Part 1, we connected Continual to Snowflake and used a simple dataset of customer information, activity, and churn status to build and operationalize a machine learning model in Continual to predict the likelihood of a customer churning.