Analytics

AI Data Mapping: How it Streamlines Data Integration

AI has entered many aspects of data integration, including data mapping. AI data mapping involves smart identification and mapping of data from one place to another. Sometimes, creating data pipelines manually can be important. The process might require complex transformations between the source and target schemas while setting up custom mappings.

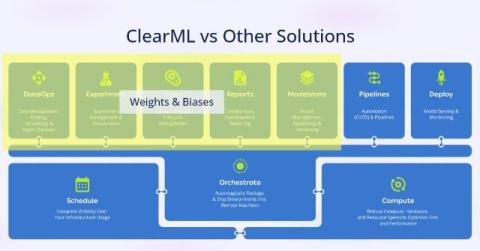
How ClearML Stacks Up Against Alternate Solutions - Weights & Biases

At first glance, ClearML’s AI Development Center and alternatives such as Weights & Biases seem to offer similar capabilities for MLOps. For example, both solutions support experiment management, data management, and orchestration. However, each product is designed to solve a different use case. It is important to understand how these approaches affect the user experience.

Transforming Customer Support with Qlik Answers

Watch as an HVAC manufacturer's customer service rep leverages Qlik Answers to provide instant, accurate information to a HVAC contractor, inquiring about a replacement air conditioning system. This video showcases how Qlik Answers uses simple natural language question to turn technical queries into clear, actionable insights, enabling the rep to quickly address compatibility issues, warranty details, and installation guidelines and more.

Reducing Your Data Risk to Drive Innovation

Organizations today face a myriad of risks that can affect their operations, reputation and bottom line. Prime among them are the existential threats to your data, including infrastructure risks and data risks. Comprehensive data governance solutions enable you to address both your infrastructure and data risk to build a resilient and secure environment that supports your operations and protects your valuable data assets.

Driving Innovation and Efficiency with Gen AI in Life Sciences

AI has profoundly impacted the life sciences industry for the past couple of decades. In the 2000s, researchers were able to use AI to analyze the human genome, identifying genetic markers and variations that could predict an individual’s susceptibility to certain diseases. This opened the door to personalized medicine and more effective therapies for genetic disorders.

How to Drill Through in Yellowfin Dashboards

Welcome to the latest entry in Yellowfin Japan’s ‘How to?’ blog series! This series of blogs aims to provide your team with another hands-on example of adding data visualization to your Yellowfin dashboards, using our array of chart and graph types. In the previous blog, we created a Combination Chart by aggregating on the basis of Year and Month.